Mapal One Release - 26.03.2026
Features & Enhancements
Big and bold additions to the product.
New functionality that changes what you can do.
Flow / Engagement – Explore Learning – Share Learning Items via Chat
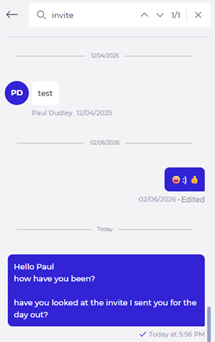
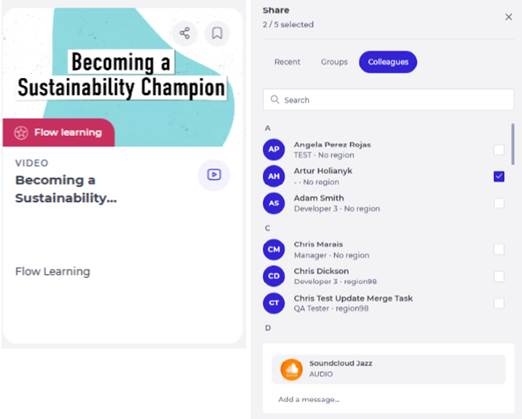
Employees can now share learning content from Explore Learning directly through Chat. A Share icon will appear on learning item tiles, enabling Employees to quickly recommend useful training to colleagues. When selecting the Share icon, Employees will be able to choose recipients and send the learning item through Chat with a link to access the content.
Why this matters
Employees often discover valuable training within Explore Learning but have no simple way to recommend it to colleagues. Adding sharing will make learning more collaborative and encourage knowledge sharing across teams.
Key benefits
- Easier knowledge sharing: Employees will be able to recommend learning content directly to colleagues.
- Seamless experience: Learning items will be shared through the existing Chat experience.
- Flexible sharing options: Employees will be able to share with up to five individual colleagues or one chat group.
- Editable message: The shared message will include a default message that Employees can edit before sending.
Behaviour summary
- A Share icon will appear on learning item tiles within Explore Learning.
- Selecting the icon will open a chat sharing panel to choose recipients.
- Employees will be able to share with up to five individual colleagues or chats.
- The shared message will include:
- the learning item title
- a link to open the learning content
- Sharing will only work for Employees who have access to both Explore Learning and Chat.
Engagement – Priority Messages
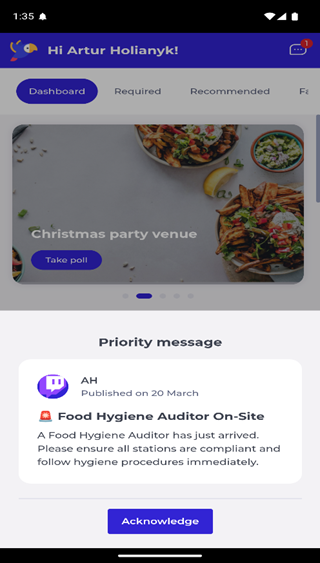
Mapal One now can show a Priority Messages, allowing Employees to receive and view urgent communications directly within the app. These messages will appear immediately on screen to ensure important updates are not missed.
Priority Messages will be used for time-sensitive information, such as operational changes, urgent notices, or important business updates.
Why this matters
Businesses occasionally need to communicate urgent information to Employees quickly. Important updates can be missed or delayed. Priority Messages will provide a clear and immediate way to notify Employees about critical updates.
Key benefits
- Immediate visibility: Priority Messages will appear instantly to ensure urgent updates are seen.
- Clear urgency: Visual styling will indicate that the message requires attention.
- Simple acknowledgement: Employees will be able to acknowledge the message with a single action.
- Improved communication: Businesses will have a reliable way to communicate important updates to Employees.
Behaviour summary
- Priority Messages will be delivered through a notification.
- When the notification is received, a pop-up message will appear immediately on the page the Employee is currently viewing or via a push notification which when clicked will navigate to the feed.
- The message will include visual indicators to highlight urgency.
- Employees will have one available action: Acknowledge.
- Selecting Acknowledge will close the message and allow the Employee to continue using the app.
- Once acknowledged, the acknowledgement will be recorded within the Engagement system.
- The priority message is configured in Engagement.
Engagement – Improve Visibility of Surveys and Polls
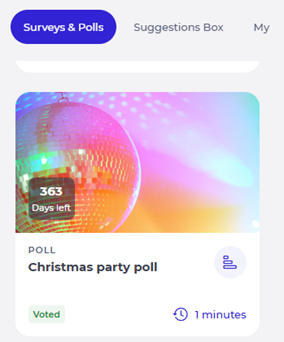
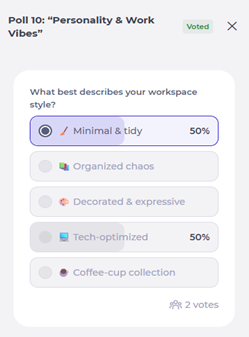
Mapal One has enhanced how Surveys and Polls are displayed across the platform to ensure Employees can easily discover and respond to Polls.
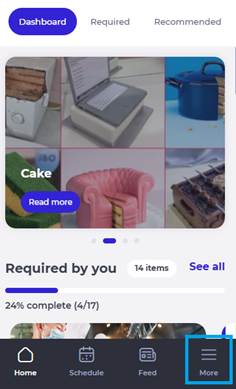
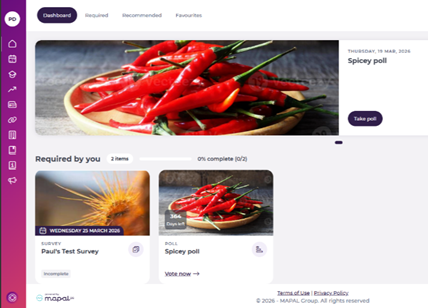
Polls will become more visible in several key areas of the experience. When a Poll is assigned to an Employee, it will appear in the “Required by You” section and the main Dashboard carousel, helping Employees quickly identify items that require their response. Within the Surveys and Polls page, both content types will also be displayed more evenly so Employees can immediately see available Surveys and Polls without needing to scroll or switch sections.
Why this matters
Polls are already available in Mapal One, but their visibility was limited. Employees may not always realise that new Polls are available, which can reduce participation and engagement. By surfacing Polls in key areas of the Dashboard and improving how Surveys and Polls appear within the Engagement page, Employees will more easily discover items that require their attention.
Key benefits
- Improved visibility: Polls will appear in the “Required by You” section and the Dashboard carousel
- Faster participation: Employees will immediately see when a Poll requires their response.
- Increased engagement: Improved discoverability will help drive higher participation.
Golden Nuggets
Small changes, big impact.
Quick wins inspired directly by your feedback.
Workforce – View Current and Future Holiday Preferences
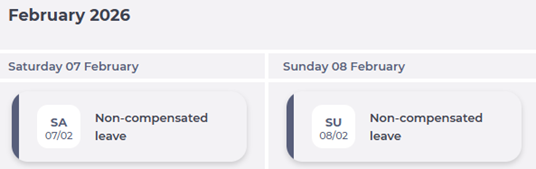
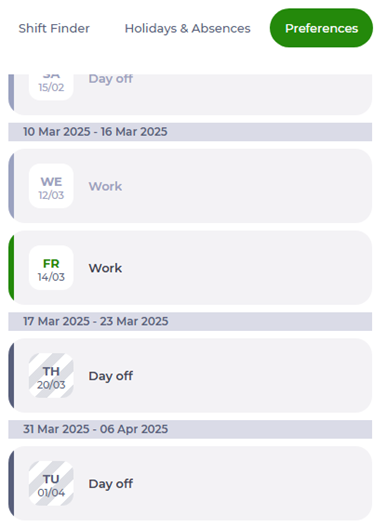
Employees will now be able to view both current and future Holiday Preferences within the Shift & Absences ? Preferences section. This improvement will make it easier for Employees to understand what preferences they have submitted and when those preferences apply.
Holiday Preferences will also be displayed using a clearer layout aligned with the Assigned tab design, helping Employees quickly recognise the relevant week and year.
Why this matters
Previously, Holiday Preferences only display entries for the current holiday year. This means Employees cannot see preferences that have already been submitted for future holiday periods, which can create uncertainty about whether their requests were recorded.
By showing both current and future preferences in a clearer format, Employees will have better visibility of their holiday planning.
Key benefits
- Improved visibility: Employees will be able to view both current and future Holiday Preferences.
- Clearer structure: Preferences will be organised by week and year for easier understanding.
- Greater confidence: Employees will be able to confirm that their future holiday preferences have been recorded.
- Consistent experience: The layout will align with the design used in the Assigned tab.
Improvements
Refinements that make things smoother and better.
Performance, usability and quality upgrades.
Engagement – Anonymous Evaluations Visibility
Mapal One will clearly indicate when an evaluation is anonymous within the Evaluations section, helping Employees understand whether their feedback will be shared anonymously.
Why this matters
Currently, there is no clear indication when an evaluation is anonymous, which can create uncertainty for Employees when submitting feedback.
Key benefits
- Clear visibility: Employees will easily see when an evaluation is anonymous.
- Increased confidence: Employees will better understand how their feedback is shared.
- Improved transparency: Evaluation types will be clearly communicated.