Start from: The Analytics dashboard.
-
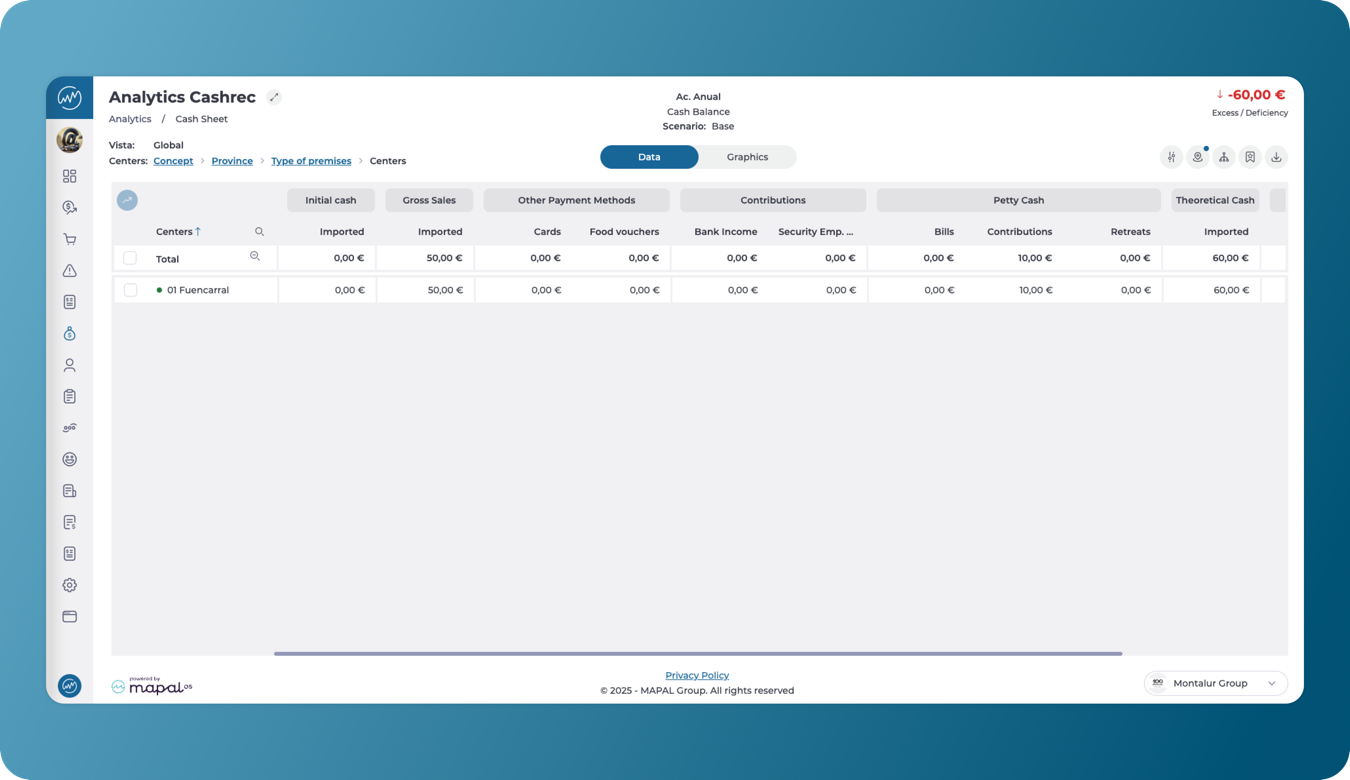
Navigate to Cashrec from the main menu.
-
The screen will display a grid.
-
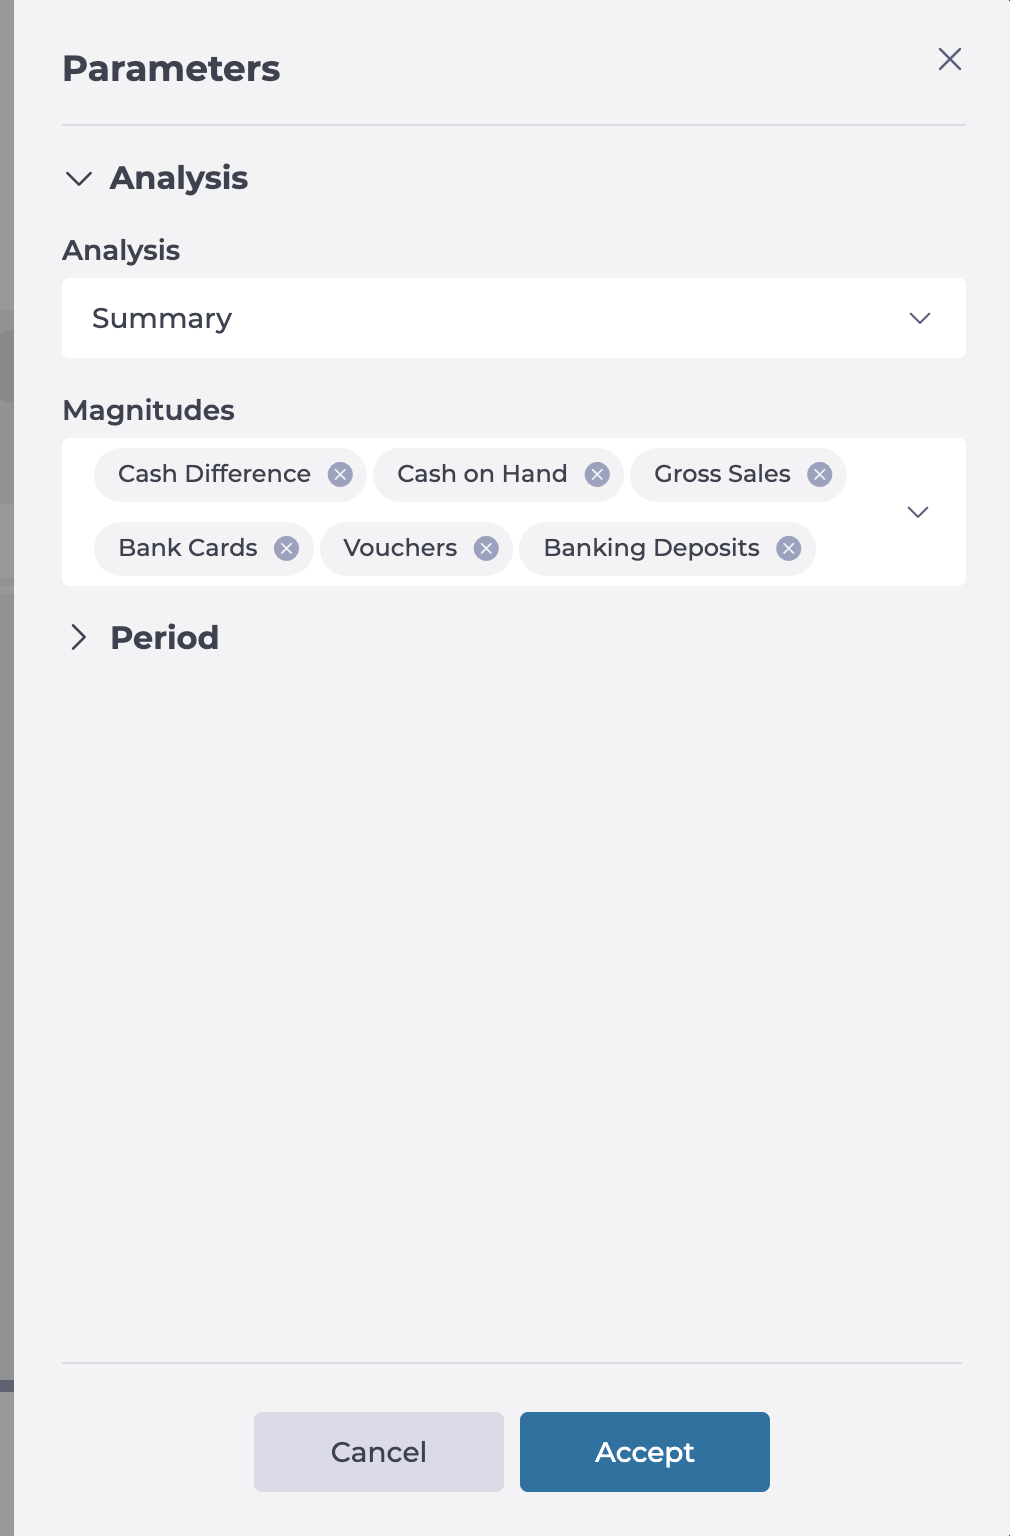
Use the Parameters button to adjust the grid view and data to match your needs. Here, you can:
-
Select an Analysis Type based on the financial insights you need:
-
Summary: Provides a high-level overview of cash operations.
-
Cash Reconciliation: Compares recorded vs. actual cash flow.
-
Cash Difference: Highlights discrepancies in cash transactions.
-
Sales: Displays revenue-related metrics.
-
Means of Payment: Breaks down payment methods used.
-
Expenses: Tracks recorded business expenditures.
-
Cash Deposits & Withdrawals: Details financial transactions involving cash movements.
-
Banking Deposits: Shows bank deposit activities.
-
-
Select the Magnitudes to be displayed in the grid:
-
Cash Flow & Balances:
-
Cash Difference
-
Cash on Hand
-
Cash Fund
-
Pending Deposit
-
Cash Pickup
-
-
Sales & Revenue:
-
Gross Sales
-
Net Sales
-
VAT (Value Added Tax)
-
VAT %
-
Guests
-
-
Payments & Transactions:
-
Checks
-
Bank Cards
-
Vouchers
-
-
Expenses & Withdrawals:
-
Total Expenses
-
Expenses (Receipts)
-
Expenses (Invoices)
-
-
Deposits & Transfers:
-
Net Cash Deposits
-
Deposits
-
Withdrawals
-
Banking Deposits
-
-
-
Set a Time Period for your data analysis:
-
Predefined Timeframes:
-
Yesterday
-
Week-to-Date (WTD)
-
Month-to-Date (MTD)
-
Year-to-Date (YTD)
-
-
Custom Periods:
-
Last Week
-
Last Month
-
Last Year
-
Custom Date Range
-
-
-
-
Once you have completed the parameterization, you will see the data organized in the grid, each magnitude will be a column.
-
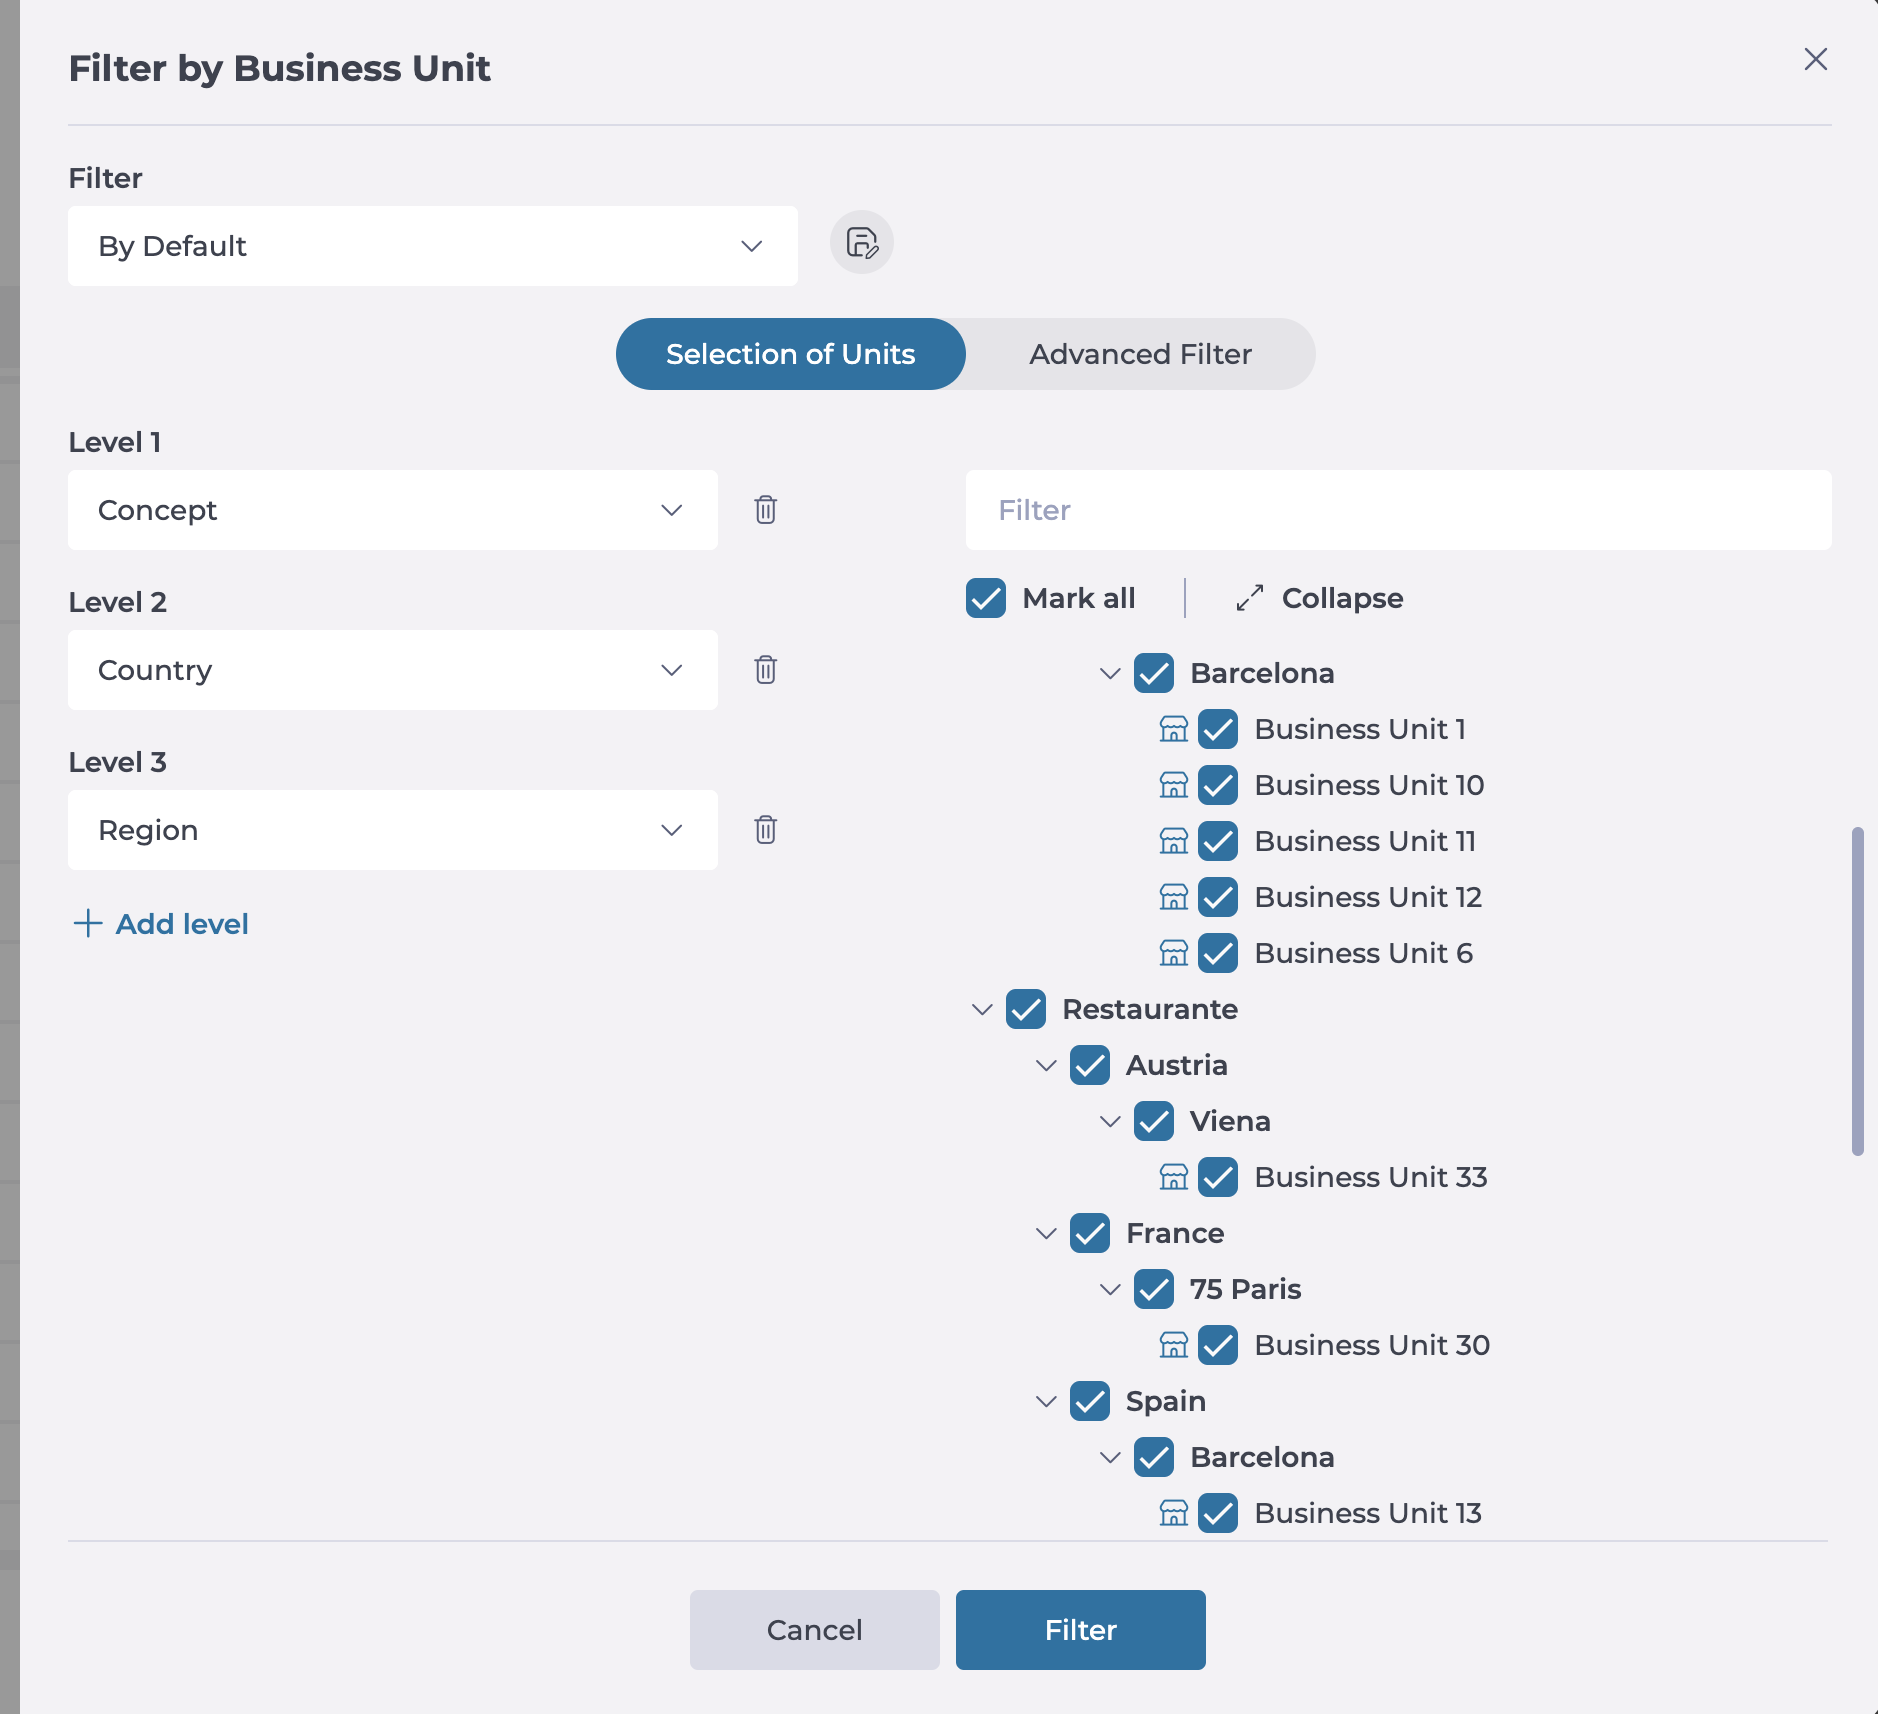
You can refine the results by using the Filter By Business Unit feature as well.
-
You can see the data in both Graphical and Tabular form.
-
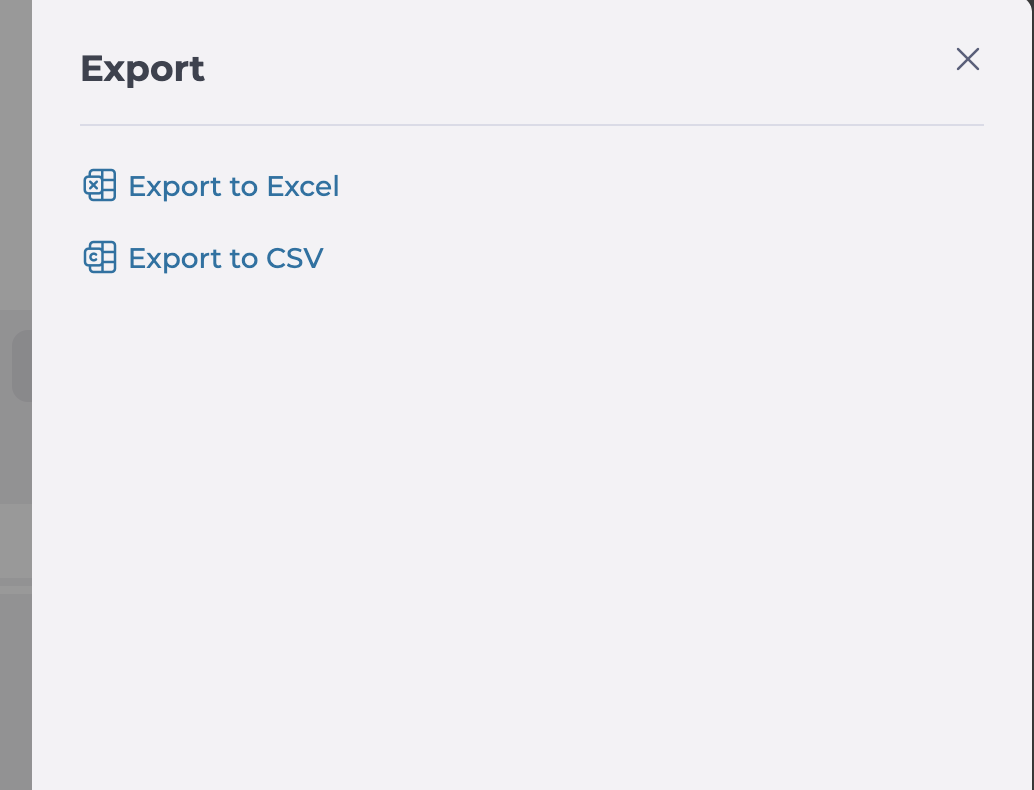
Use the Export feature to download cashflow reports in Excel or CVS formats for deeper analysis.