Understand sales types and periods
Start from: The Analytics module.
-
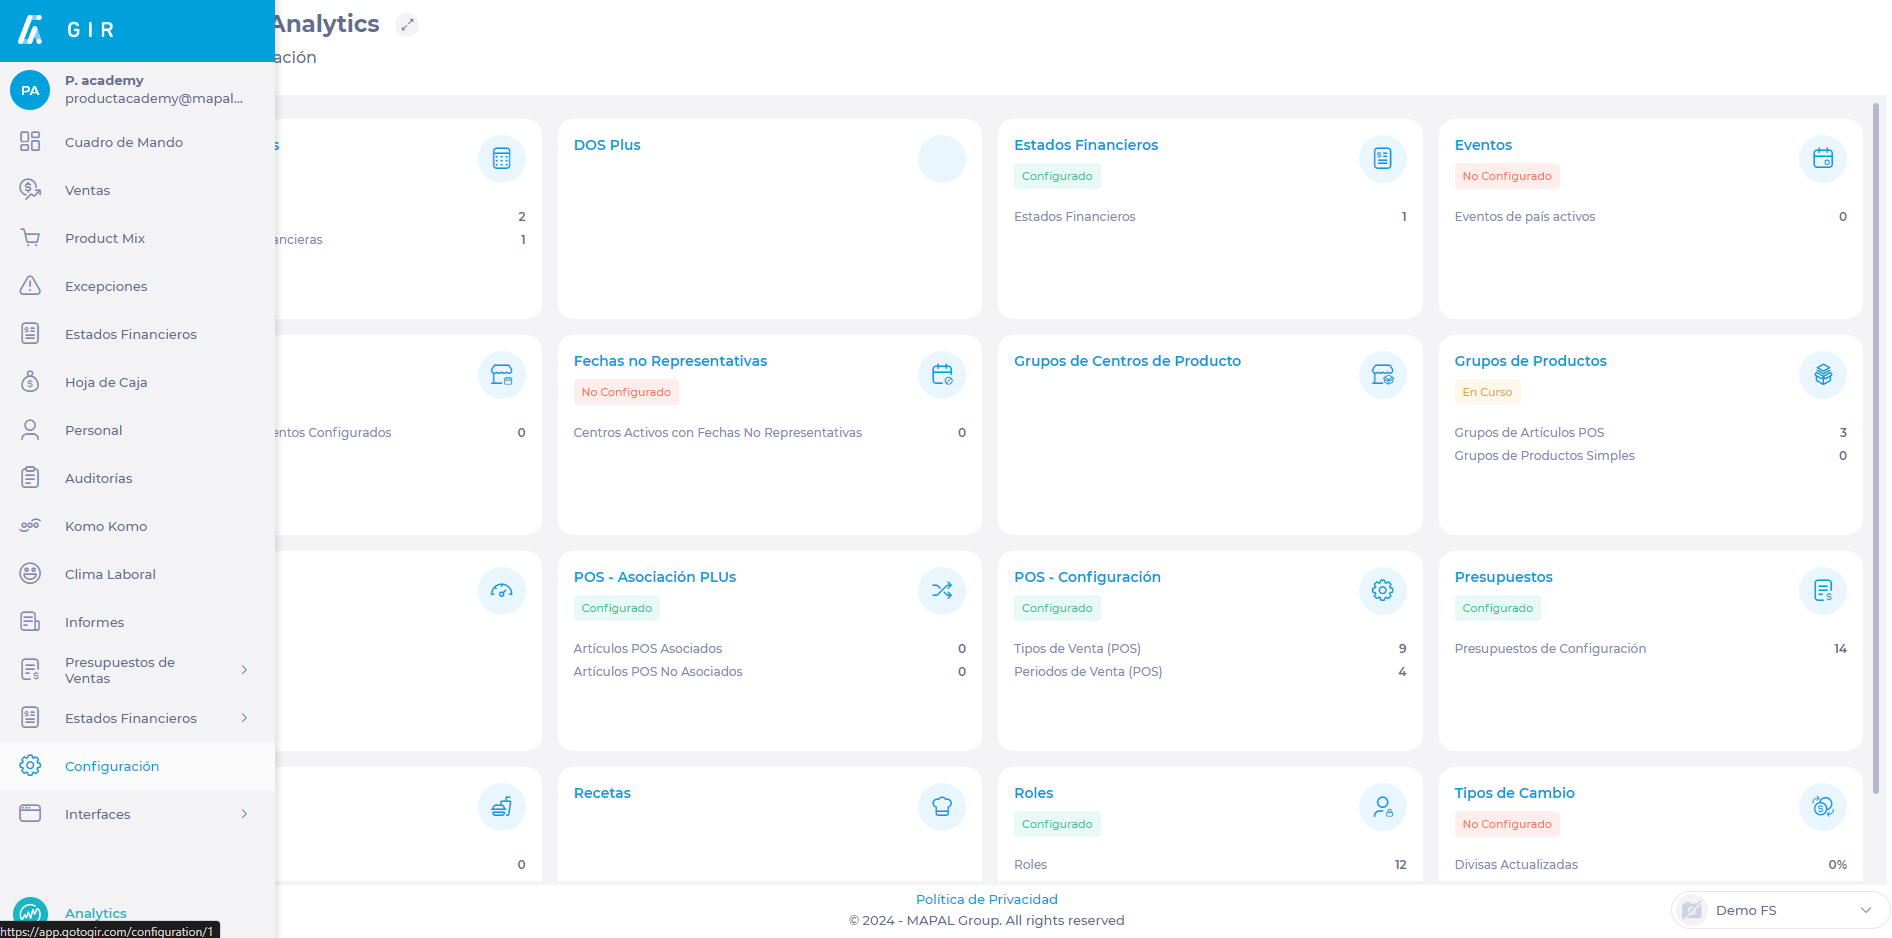
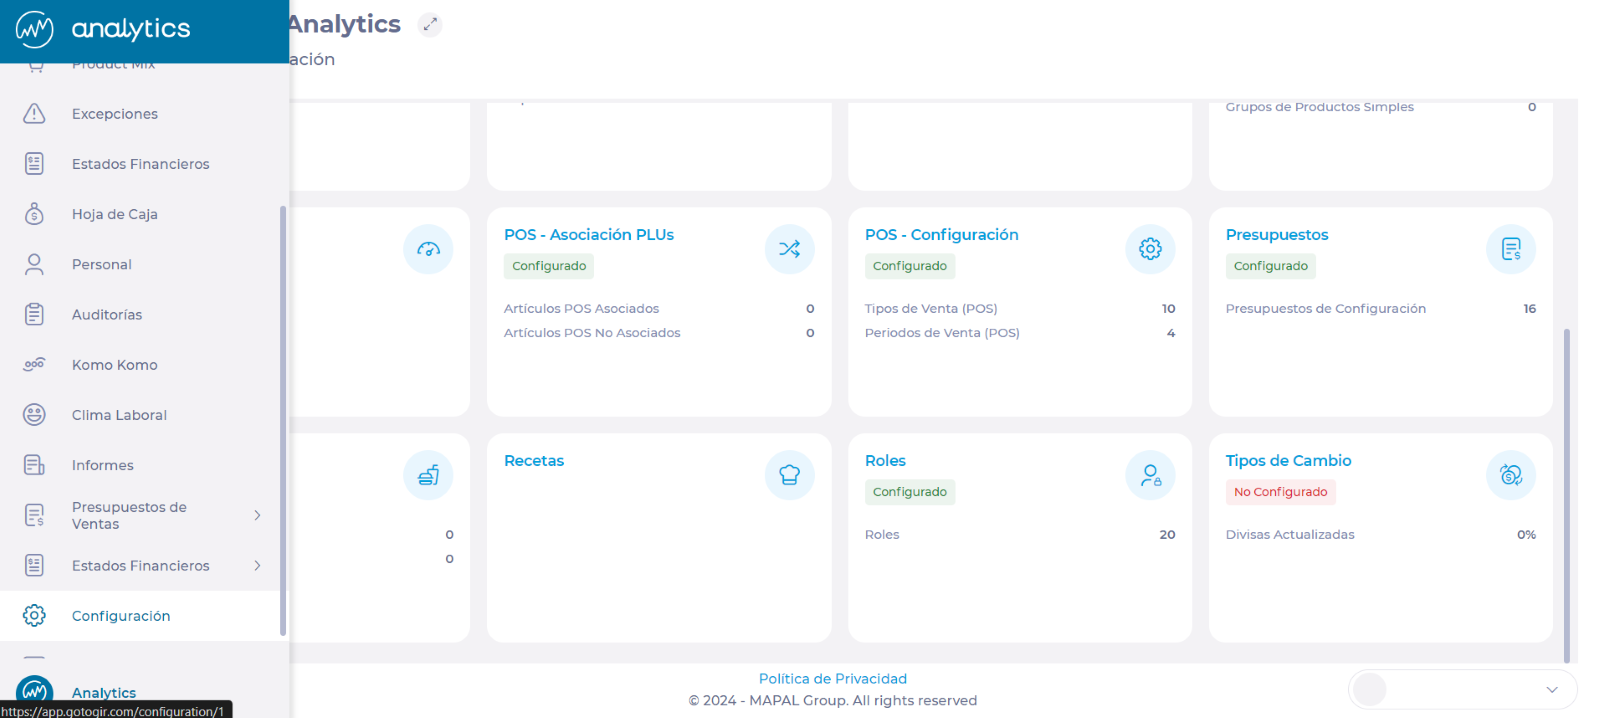
Navigate to Configuration > POS - Configuration.
In the POS - Configuration screen, you will find two tabs with their respective listings:
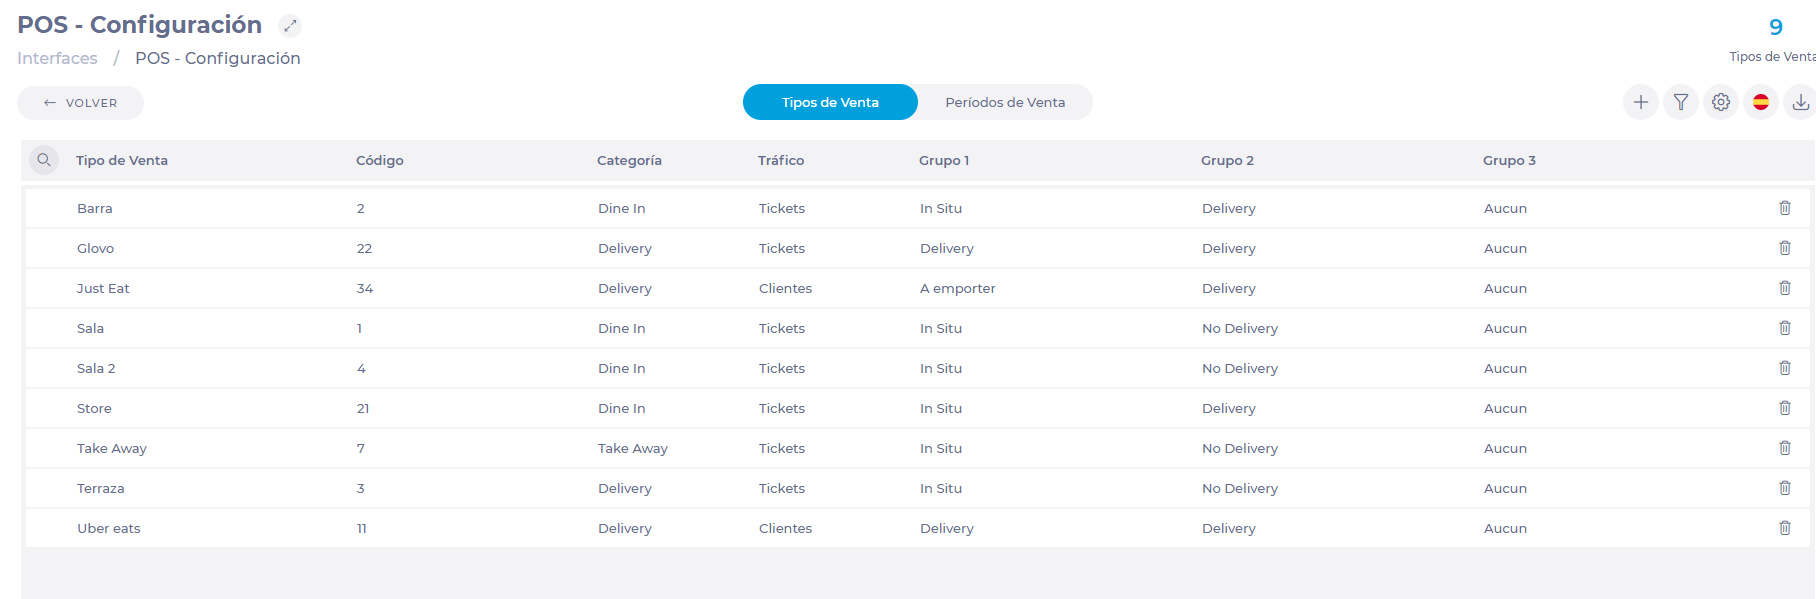
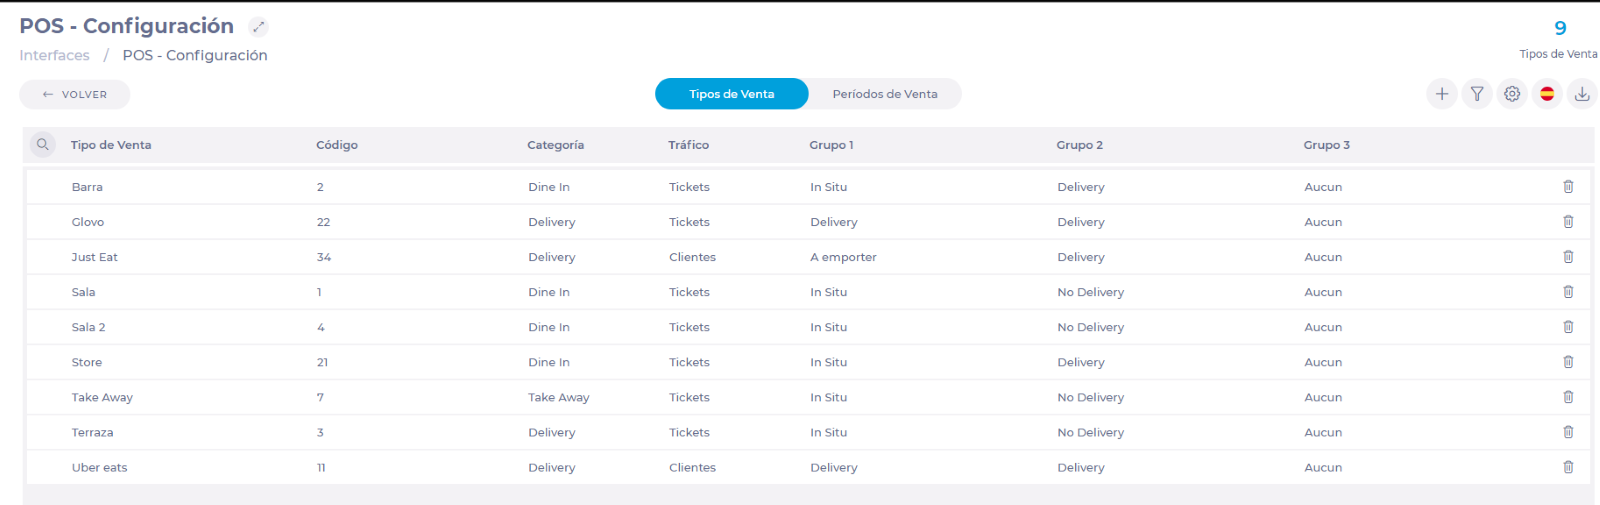
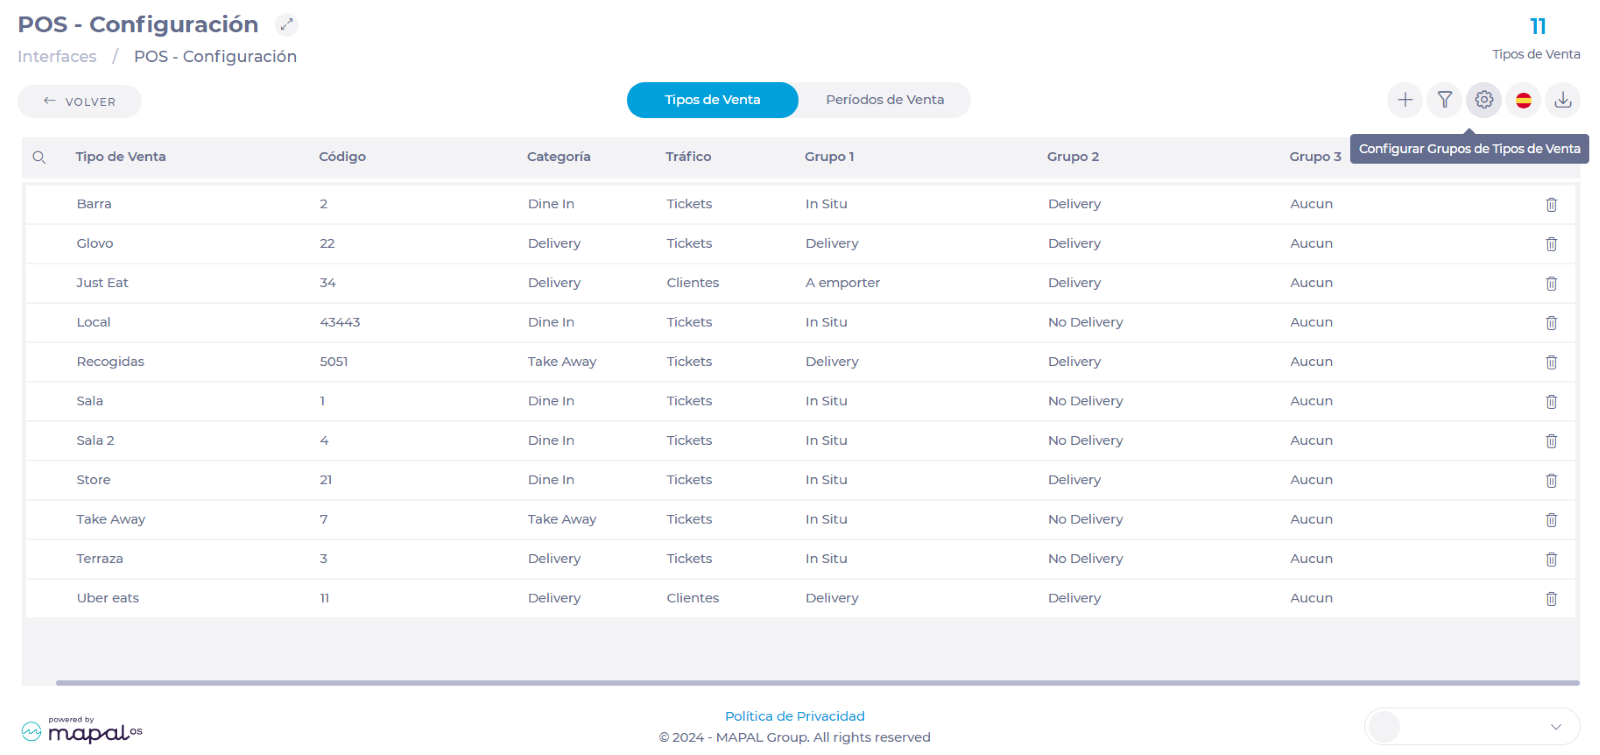
Sales Types
Sales types, also known as sales channels, are all the channels through which sales are made in a business center. Each type of sale has a code, Category, Traffic, and groups assigned to it to facilitate its location and use in the system.
These channels are previously configured in the POS and GIR extracts them from that source for use in the system's budget configuration. To edit parameters such as the name and code of the Sales Types, it is recommended to go directly to the POS configuration.
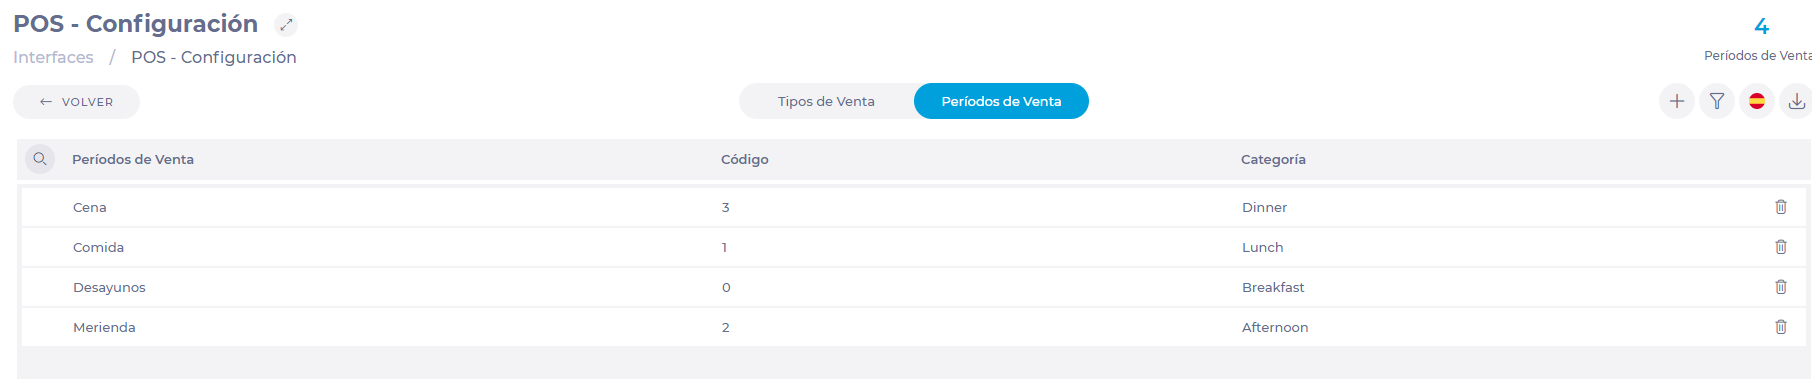
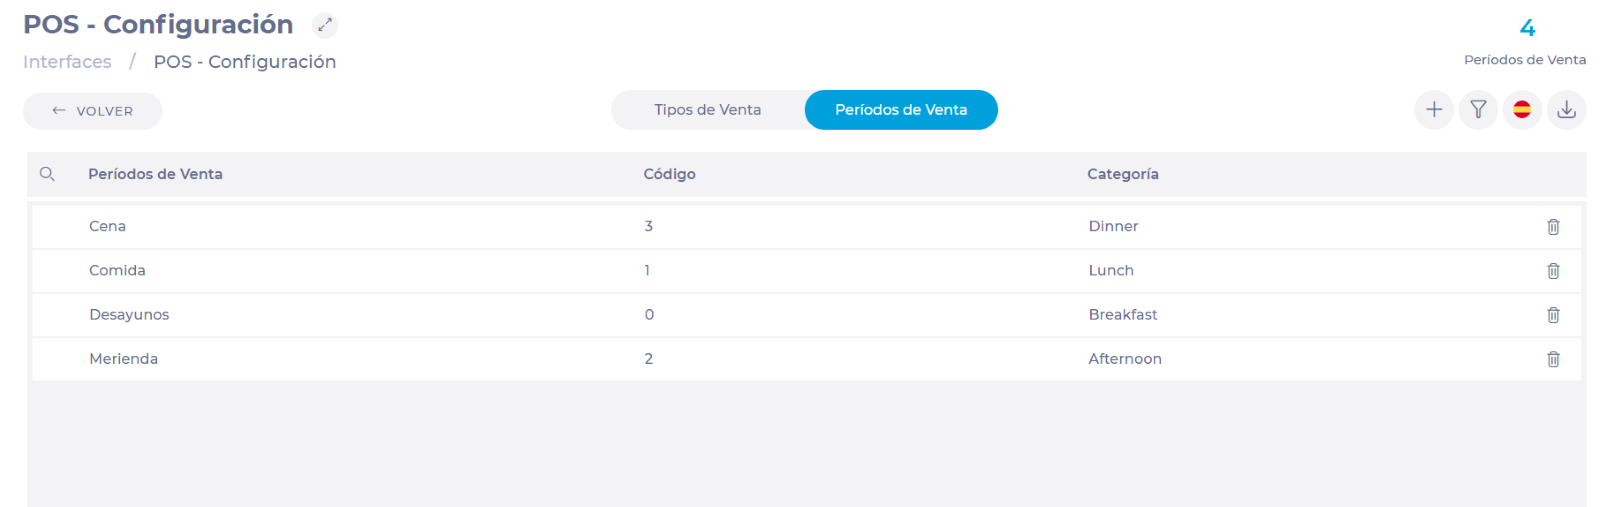
Sales Periods
Sales Periods are the time frames in which sales are made at the work center. Each period has a code and a category to facilitate its location and use in the system.
The periods are predefined in GIR and comprise four time periods: Breakfast (0), Lunch (1), PM (2), Dinner (3). The names and parameters of these periods can be changed at the user's request.
Monitor Point of Sale (POS) transactions
Start from: the Analytics dashboard.
-
Navigate to Interfaces > POS Log.

-
The POS Log interface presents transaction data in a structured grid format. Key columns include:
-
ID: Unique identification number assigned to the transaction.
-
Business Day: The operational day the data refers to.
-
Comm Date (UTC+1), Comm Date (Unit), Comm Date (Group): Timestamps that help trace communication timing and patterns across unit and group levels.
-
Report: Links to the report generated by the system.
-
Status: Indicates whether the transaction succeeded, failed, or is pending.
-
-
Users can find a specific transaction using the filters at the top to narrow down the search by Units and Status.

See a transaction's report
-
Locate the specific transaction on the grid.
-
Select the Report button on the transaction’s row.
-
A pop-up window with the transaction details will be displayed.

src="src="src="src="src="src="
Use the “Sales Forecast” screen
Note: Actions on the Easilys platform depend on your user access permissions. If you cannot perform the actions below, it may be due to restrictions on your user profile. Contact the Support team or your administrator for assistance.
Start from: The Easilys Menu.
- Navigate to Sales > Sales forecast.
1. Initialising the Sales Forecast
To define a sales forecast, you can initialise the forecast using historical sales data from another period and/or add services and recipes manually.
CASE 1: You want to generate forecasts based on sales history
The forecasts generated this way are based on sales history retrieved from the POS system: number of covers per service, average quantities sold per day, per service, and per recipe.
-
Click on Forecast.
-
Select a reference period (a full week or several weeks) to calculate the averages. For example, sales data from all Mondays of the selected reference period will calculate the average for future Mondays.
-
Choose a target period (another full week) to apply the forecast, with the option to adjust the averages by an increase or decrease percentage.
-
Enter, if needed, a change value (a percentage increase or decrease) to apply to the target period.
-
Click Validate.
The forecast will then be displayed. The forecasts are rounded up to the nearest whole number; for example, 2.3 is rounded up to 3. Days with zero sales are excluded from the calculations.
CASE 2: Manual Entry of the Forecast
With this method, the idea is to add the desired services and recipes without relying on past sales, so without first clicking on “Forecast”.
1. Add services
-
Click Add a service to add one or more services.
-
Select the desired meal types, for example, lunch, dinner.
-
Select Save.
-
If needed, you can add more services by selecting + Add a service and proceeding as before.
2. Add recipes
-
Select + Add a recipe in the desired service.
-
Select the desired recipes, using the search area if needed.
-
Click Save.
2. Adjusting the Sales Forecast
Once the forecast has been initialised, you can modify it by adding or removing services and/or recipes and by editing the numbers for future dates (white cells). Once the day has passed, actual POS data will replace these numbers and the cells are greyed out.
1. Add / Remove Services and/or Recipes
-
To add recipes or services, use the + Add a recipe and + Add a service functions as described above in the manual initialisation case.
-
To delete recipes or services: Click the bin icon next to the recipes or services to delete.
-
Confirm deletion.
Note: You can delete multiple recipes by checking the box in front of each relevant recipe, then clicking the bin icon at the top right of the screen and confirming the deletion.
2. Adjust forecast values in white cells (future dates)
-
The number of covers for each service on each date can be edited directly in the screen. If you do this, the quantity of each recipe is recalculated proportionally.
-
The quantity of each recipe can also be edited directly in the screen.
3. Validating the Forecast
-
Finalise the forecast by clicking on Validate.
-
Confirm in the pop-up window by selecting Yes.
You can then calculate order preparation and generate production documents based on this forecast.
Note: If needed, you can modify your forecast and validate it again so that it is included in the order calculations and production reports.
Identify the sales responsible for a stock withdrawal
Note: actions performed on the Easilys platform are subject to user access permissions. If you are unable to carry out the actions described in the articles, it may be because you do not have the necessary permissions activated on your user profile. Contact the Support team, or your administrator, for help.
Start from: The Easilys menu.
-
Navigate to Stock > Stock.
-
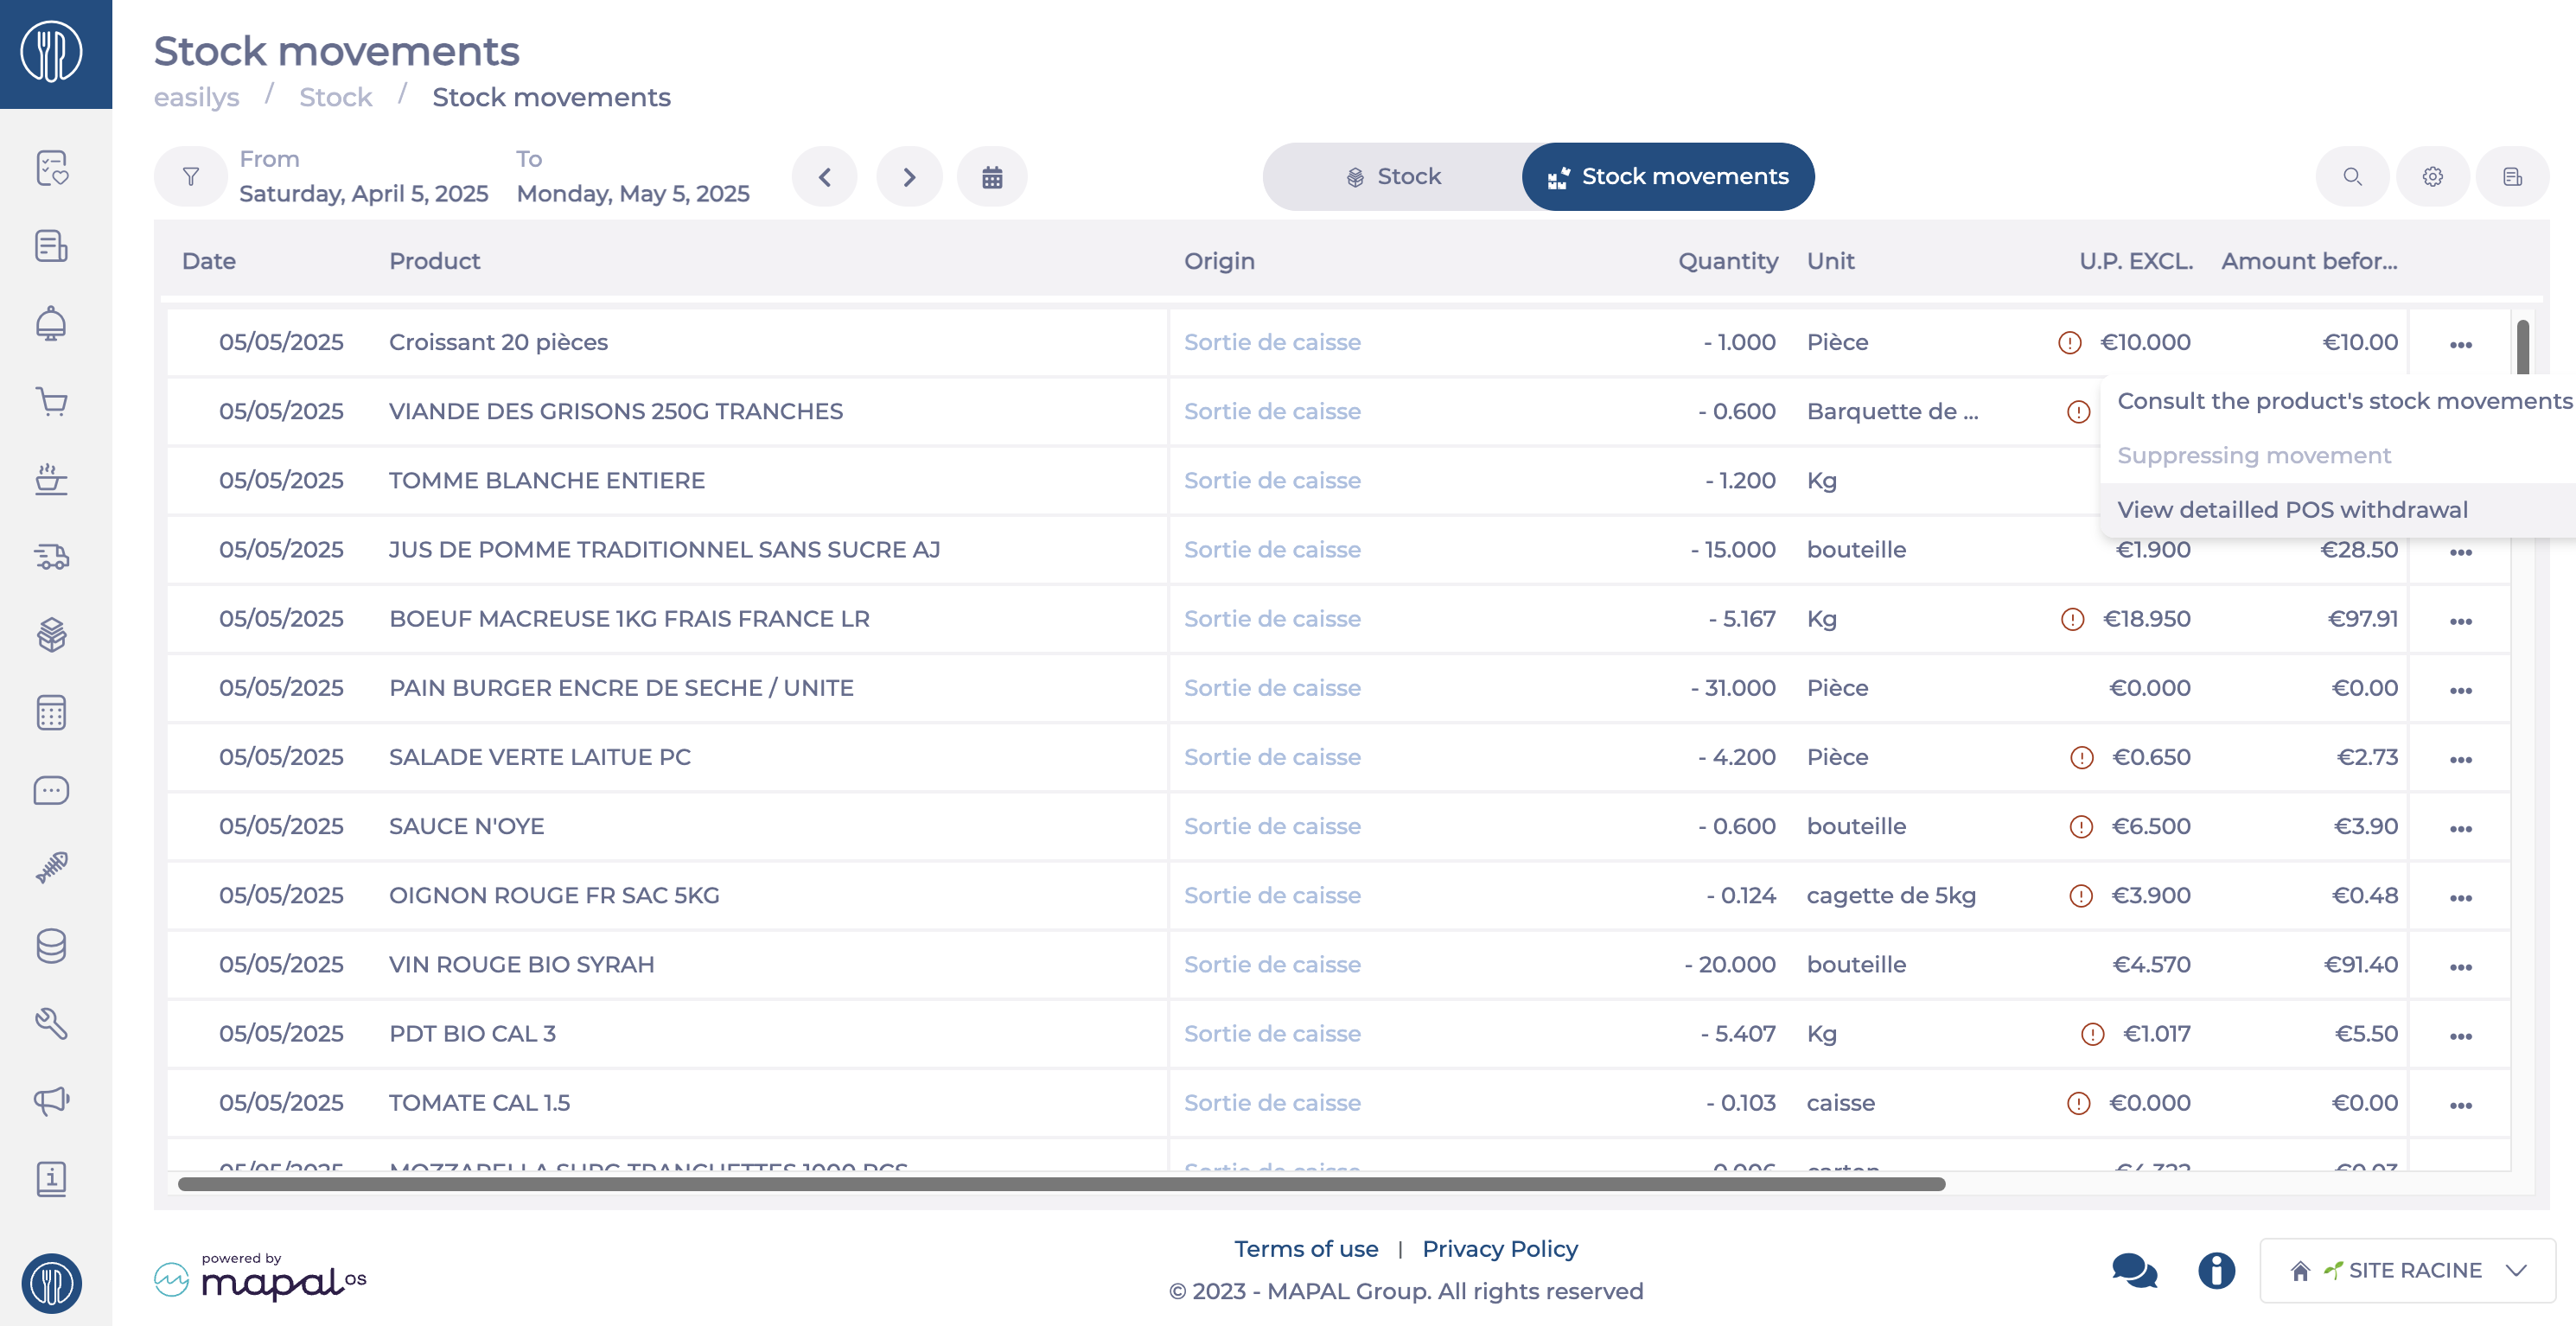
Select the Stock Movements tab to view the relevant transactions. (To know more, refer to Consult the details of stock movements made using "Stock V2".)
-
Target a movement with the origin POS Withdrawal (Sortie de caisse) by using the filter if necessary.
-
Select the POS Withdrawal movement for which you want to understand the reason. You can do this either by clicking directly on “Sortie de caisse” in the row or by using the ... button to access the View detailed POS Withdrawal function.
-
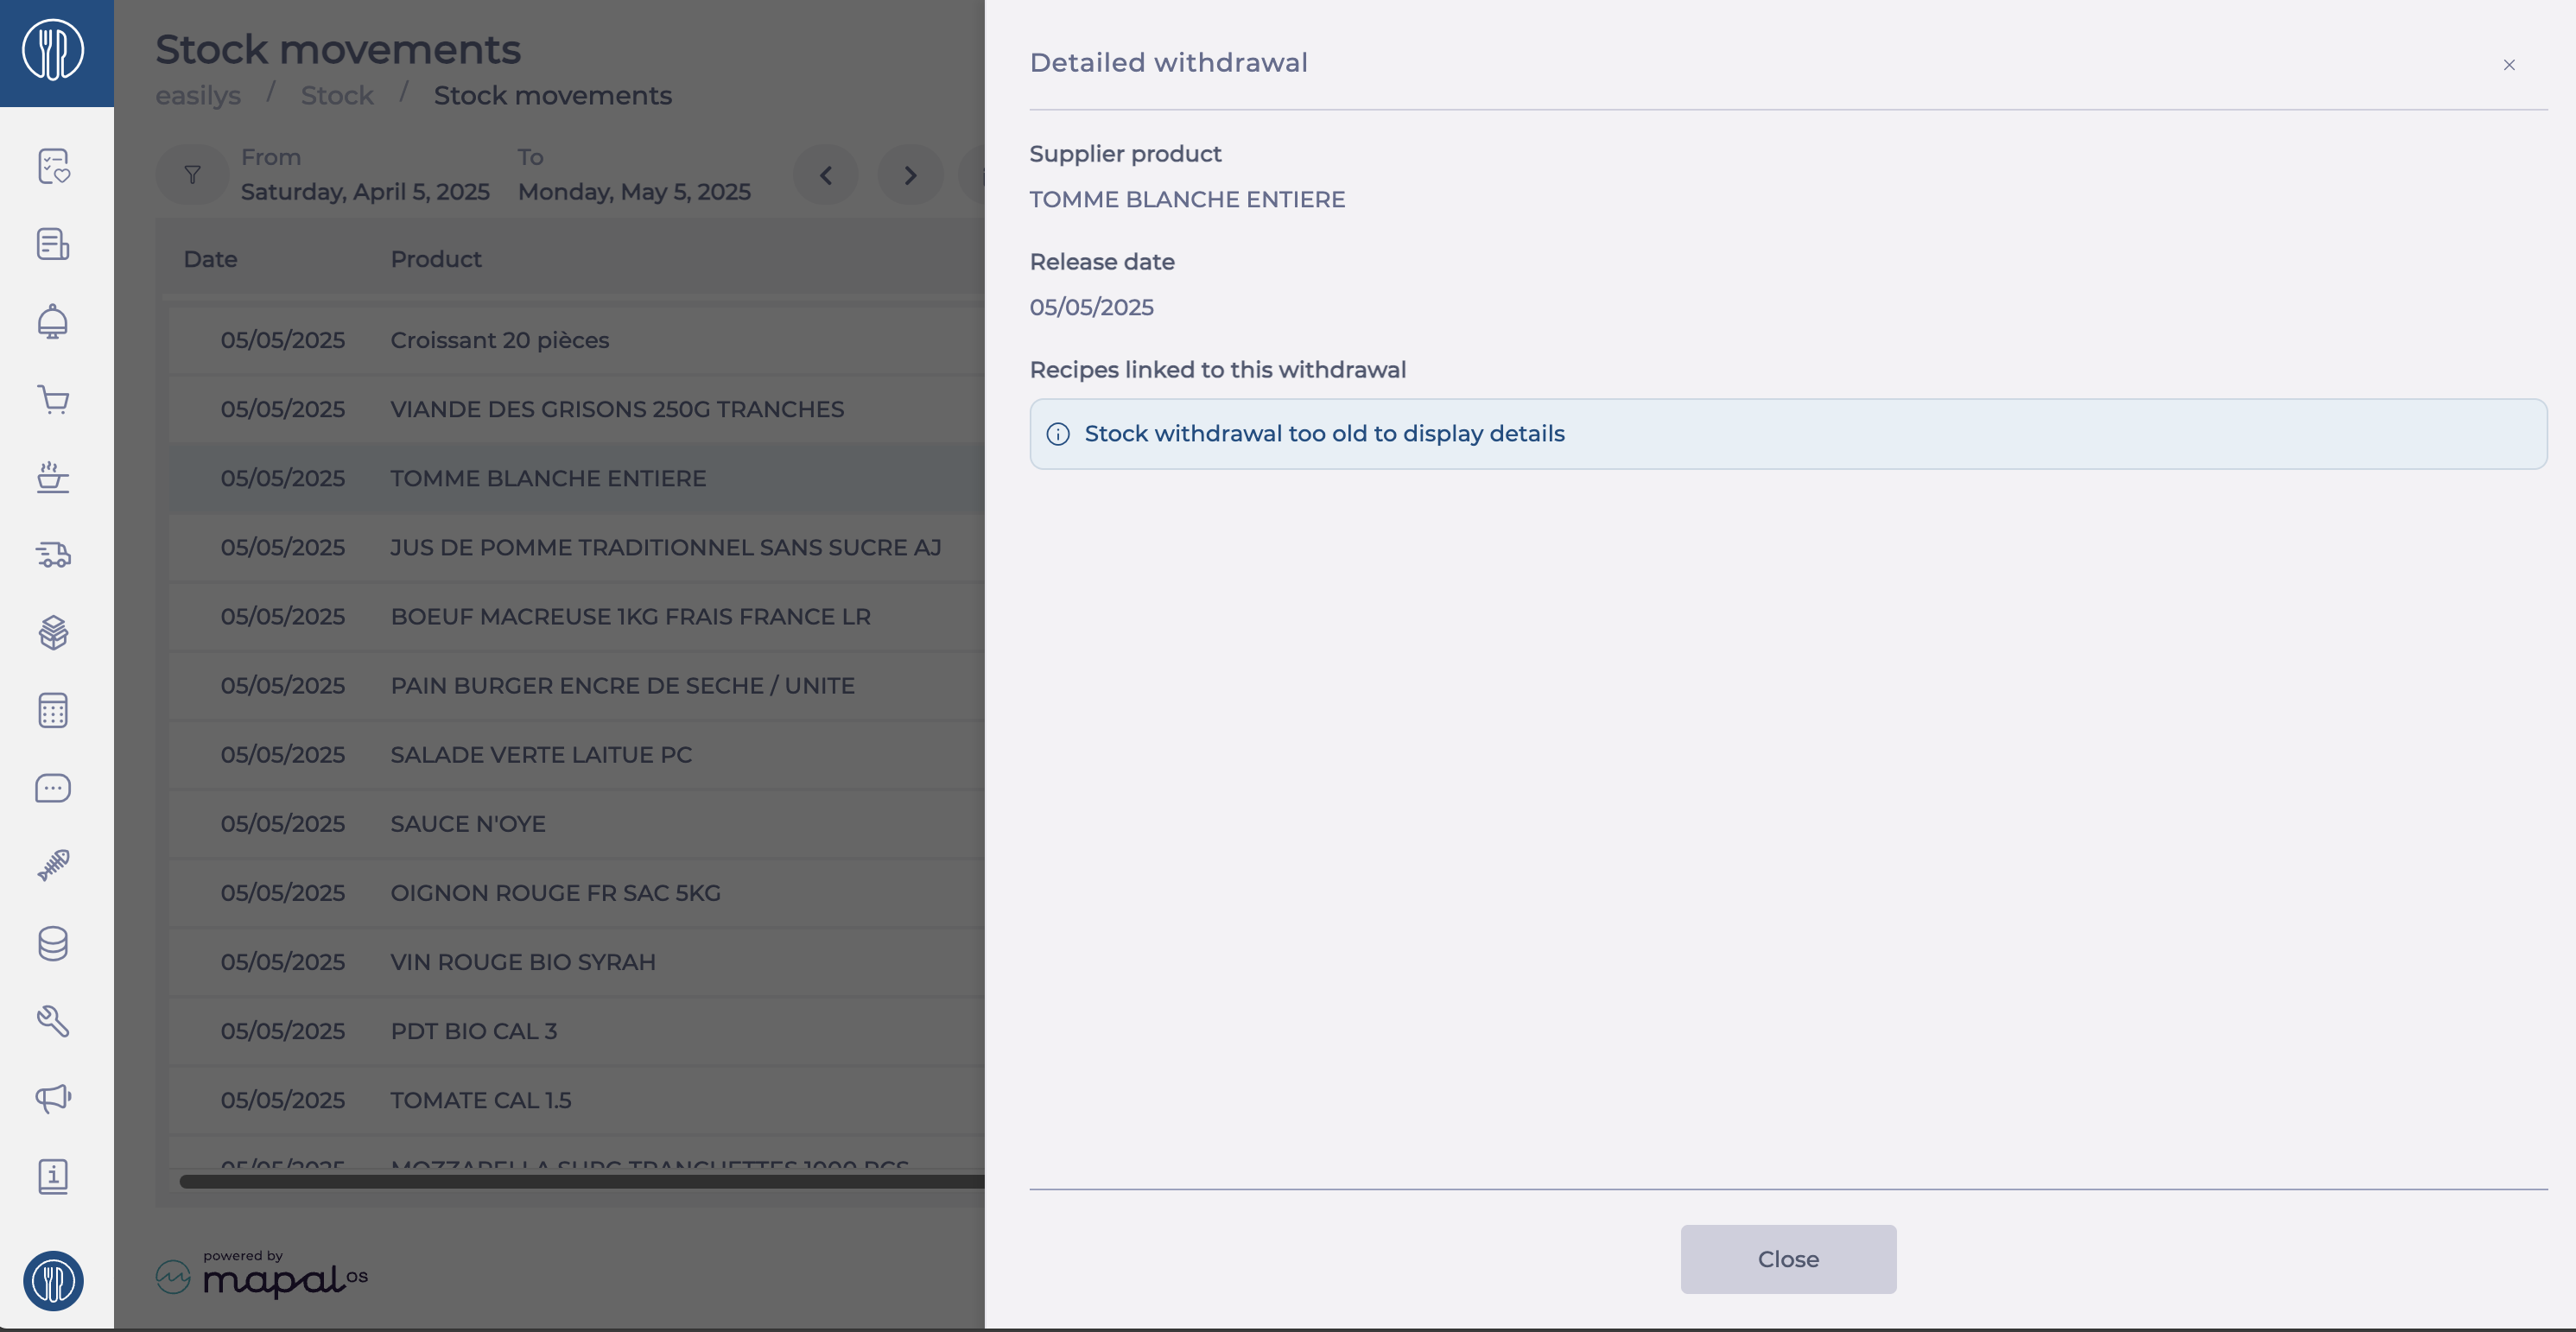
The detail panel will then appear. It shows:
-
The name of the supplier product withdrawn from stock
-
The Release date
-
The list of recipes and sub-recipes linked to this withdrawal
-
-
When the product was withdrawn from stock because it was part of recipes sold directly, you will see the names of the recipes, each with:
-
The number of portions of recipes sold
-
The quantity of product per recipe portion
-
The quantity of product withdrawn for the number of portions sold
-
-
When the product was withdrawn from stock to produce a sub-recipe included in a sold recipe, you will see:
-
The name of the sub-recipe, preceded by an icon
-
The number of sub-recipe units produced
-
You can hide or show the list of sold recipes that used this sub-recipe. This list shows for each recipe:
-
The name of the sold recipe
-
The number of portions of recipes sold
-
The quantity of product per recipe portion
-
The quantity of product withdrawn for the number of portions sold
-
-
Map PLU Products to the POS System
Start from: The Analytics dashboard.
- Navigate to Configuration > POS – PLUs Mapping.
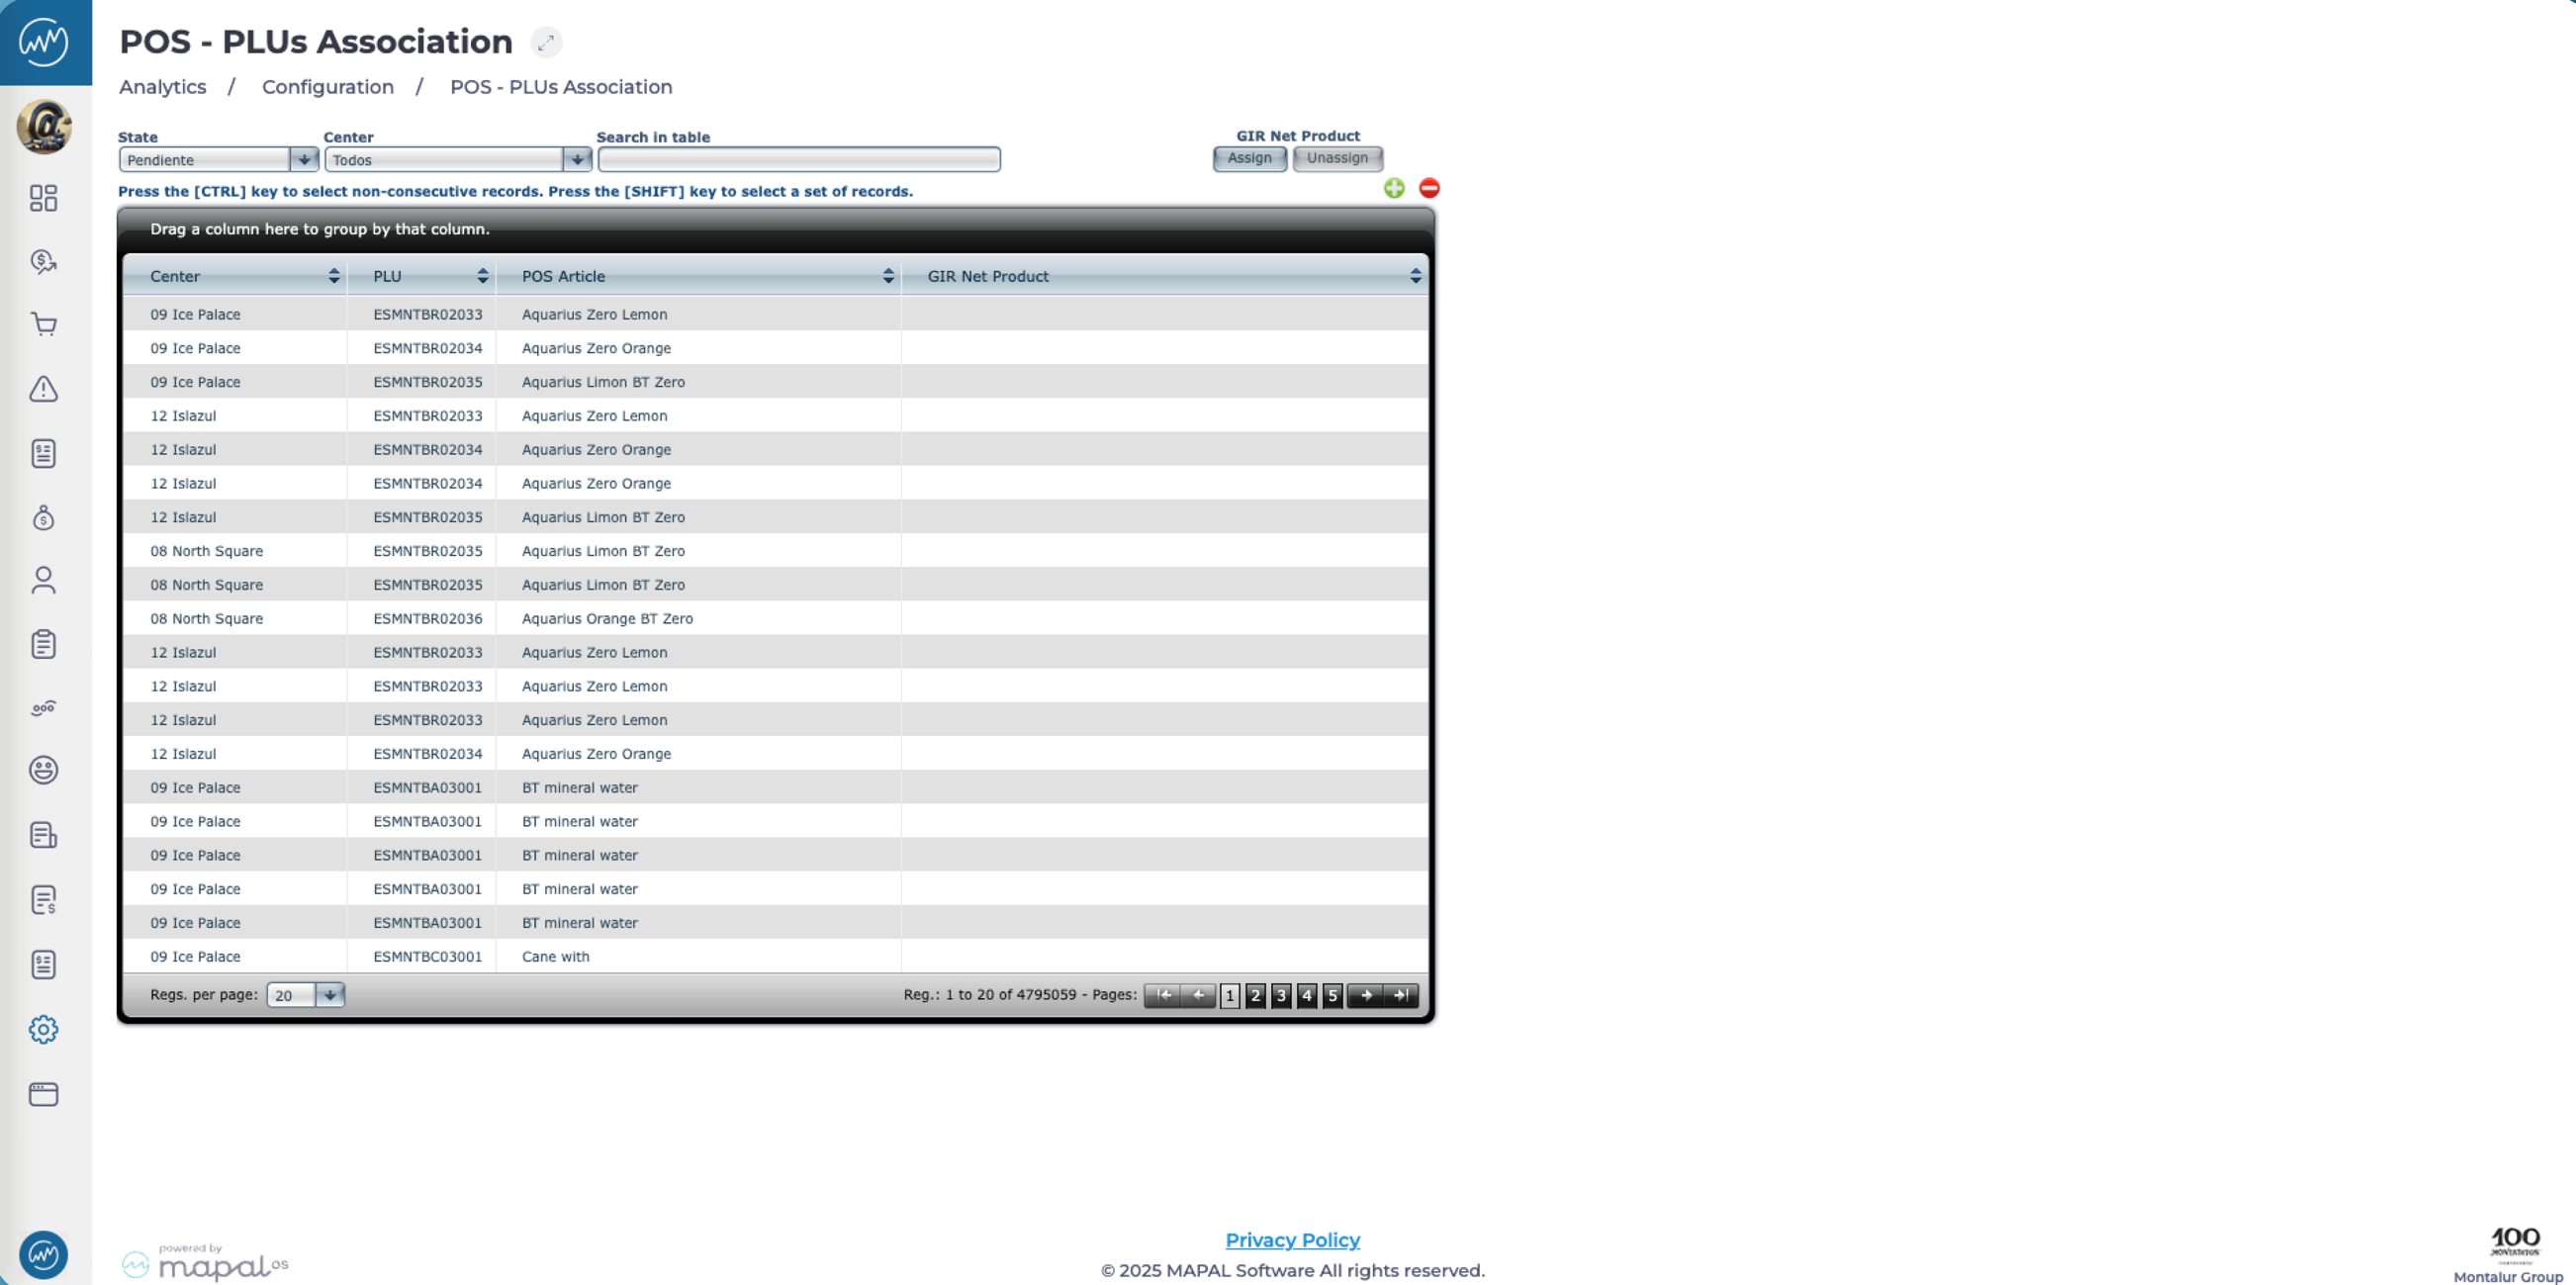
- Use the filtering tools at the top of the grid to refine your results:
- Status: Filter between Pending and Assigned entries.
- Unit: Select a specific Business Unit.
- Search in the table: Search for specific records directly from the search bar.
- Once filtered, the grid will display the relevant records in four columns:
- Unit: Indicates the business unit/sales centre.
- PLU: Displays the POS system’s PLU code.
- POS Article: Name of the item as recorded in the POS.
- Product GIR Net: The associated product in the GIR Net system.
- To group or sort information, drag a column header to the top of the table to group data by that field. This helps visualise and manage associations more easily.
- To map a product, select a PLU row and click Assign to link it with the correct GIR Net product.
- To unmap a product, select a PLU row and click Unmap to remove its association.
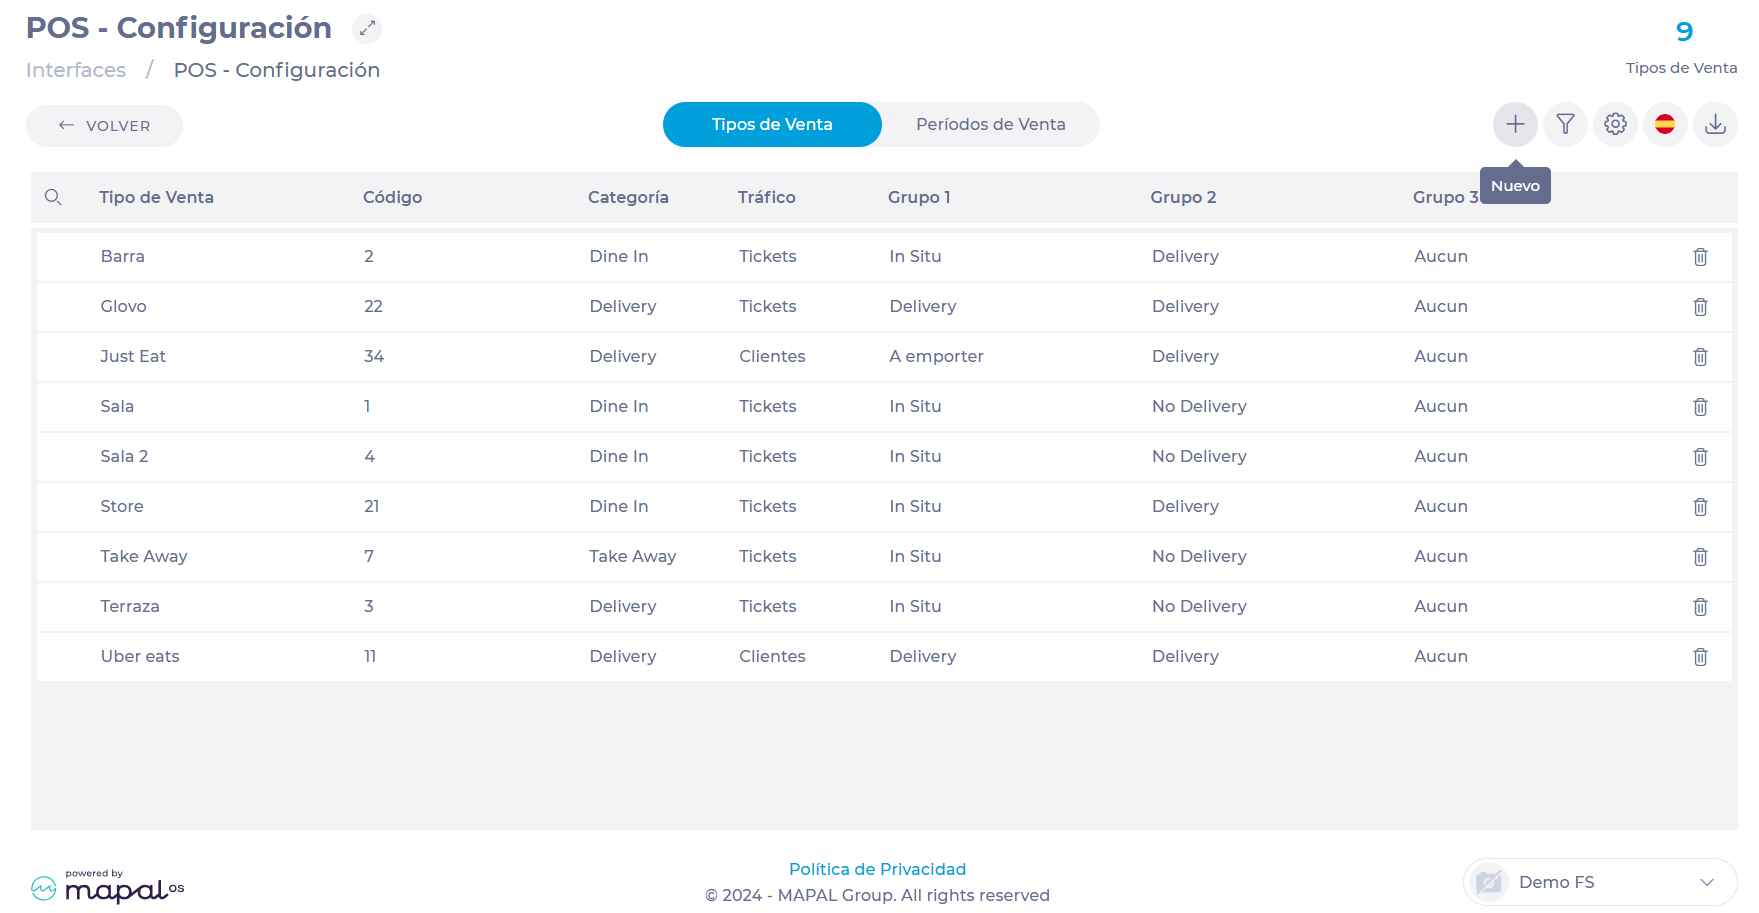
Configure POS (Point Of Sale)
Start from: The Analytics module.
- Navigate to Configuration > POS - Configuration.
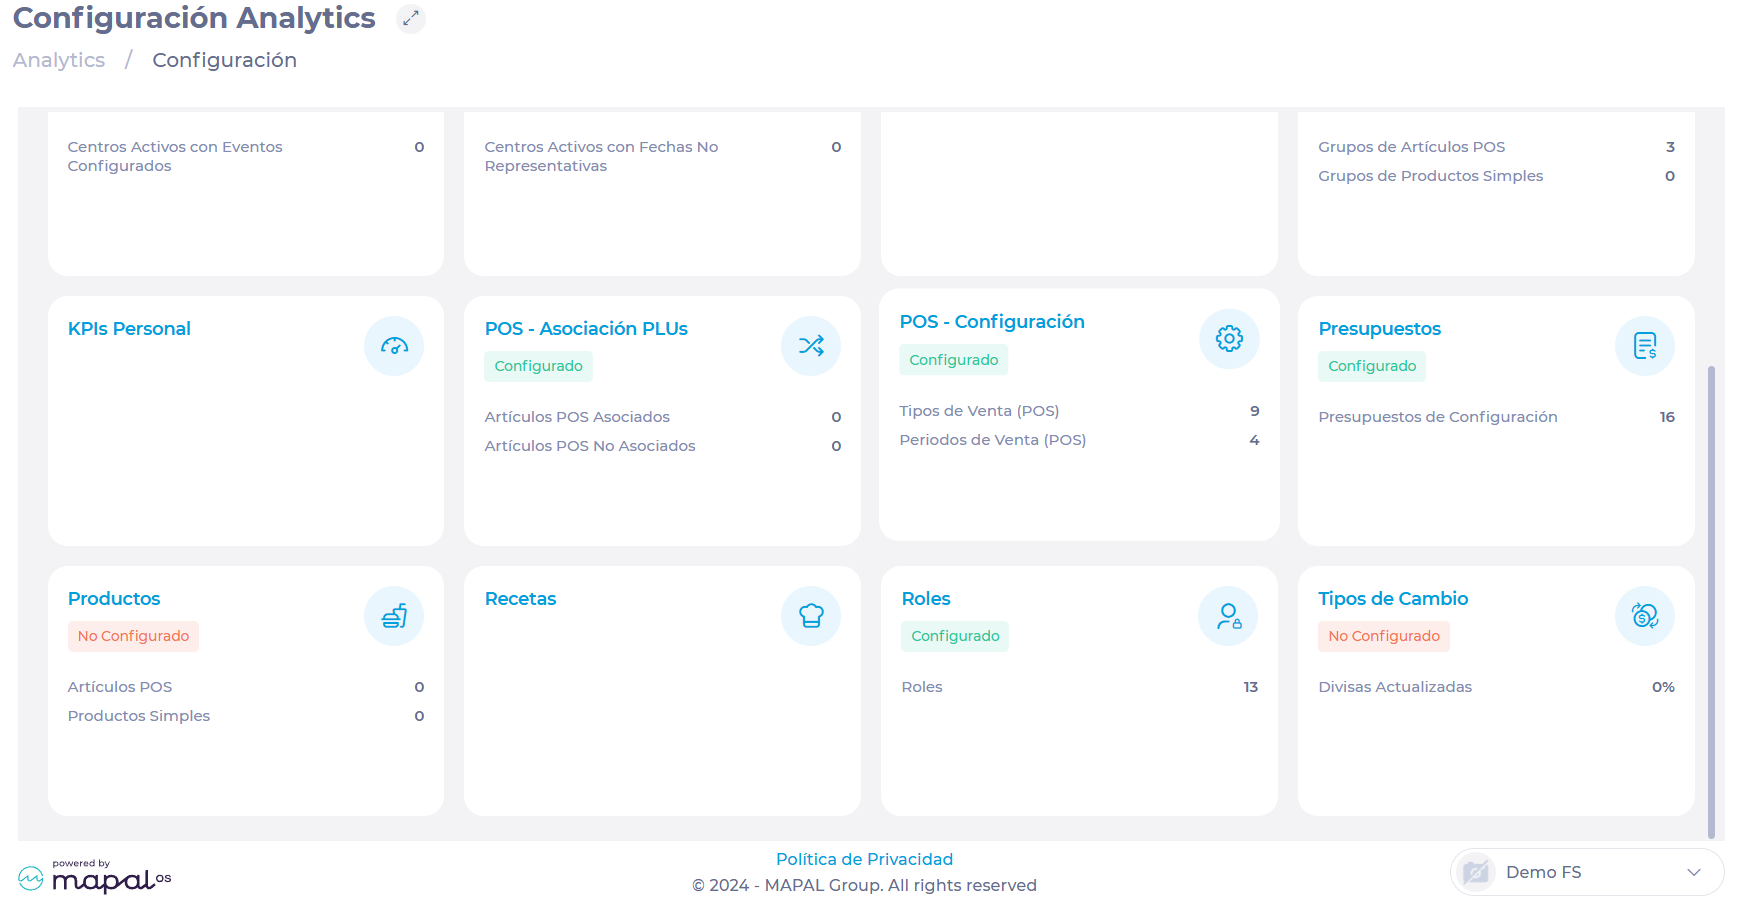
- In the POS - Configuration screen, you will find two tabs: Sales Types and Sales Periods.
To learn more about these two variables, see Understand sales types and periods.
Sales types
In this tab, you will find the sales types previously configured in the POS.
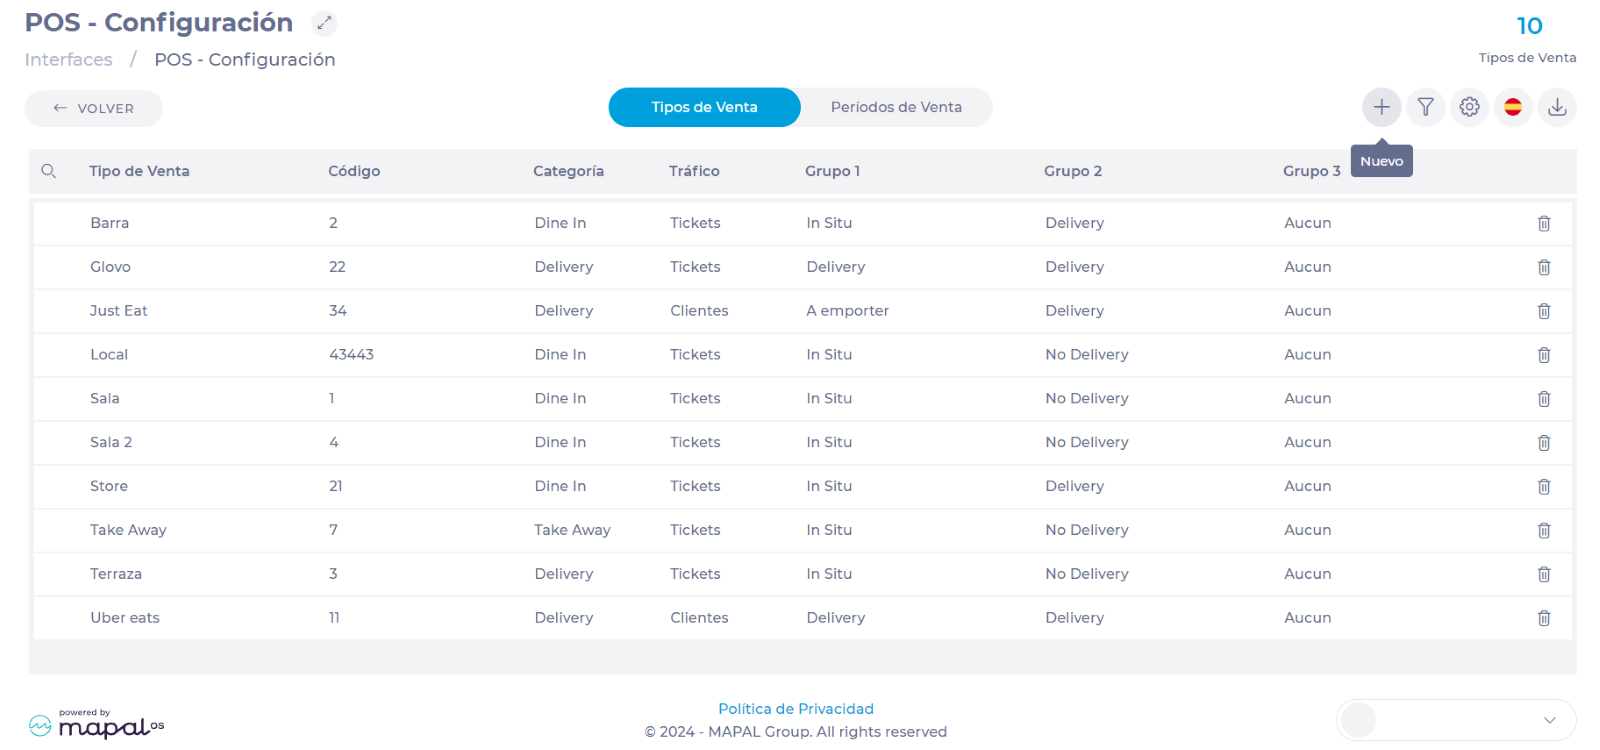
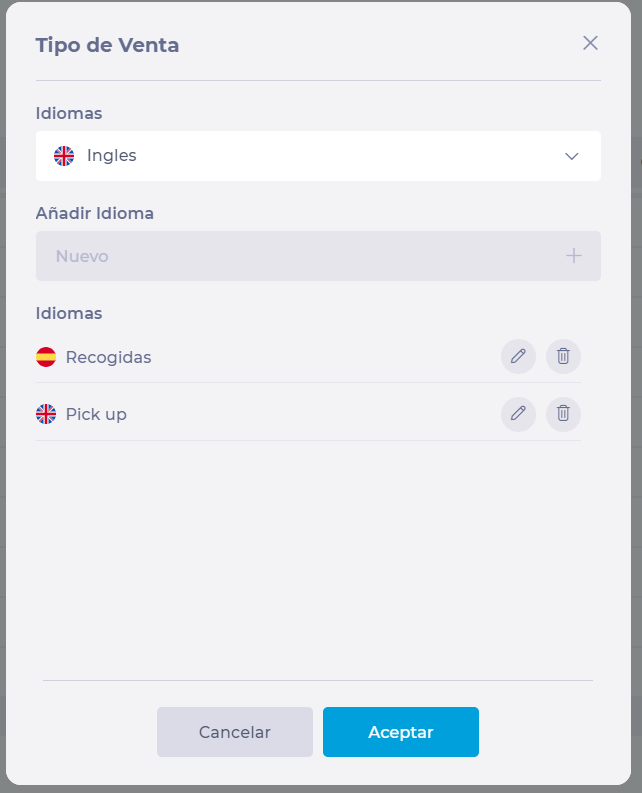
To create a new sales type:
- Select New +.
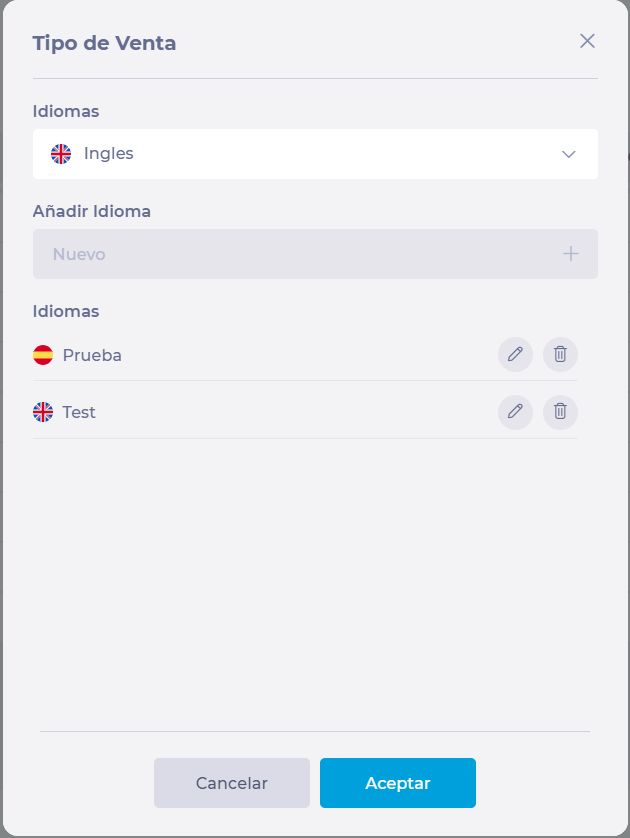
- Select the Sales Type field to assign a name and its respective translations.
- Select a language from the Language drop-down list.
- Assign a name in the text field and select Add +.
- Select Accept to save the name and translations of your new sale type.
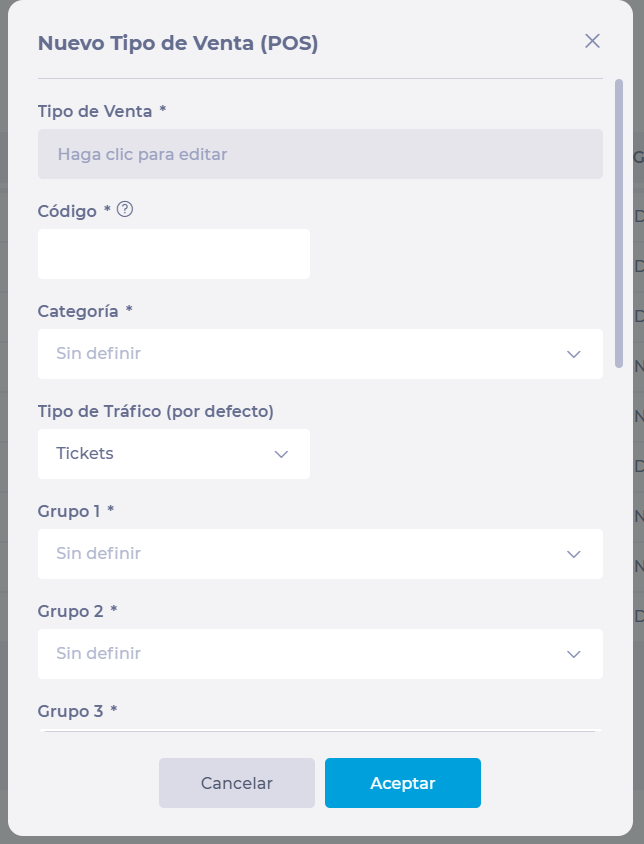
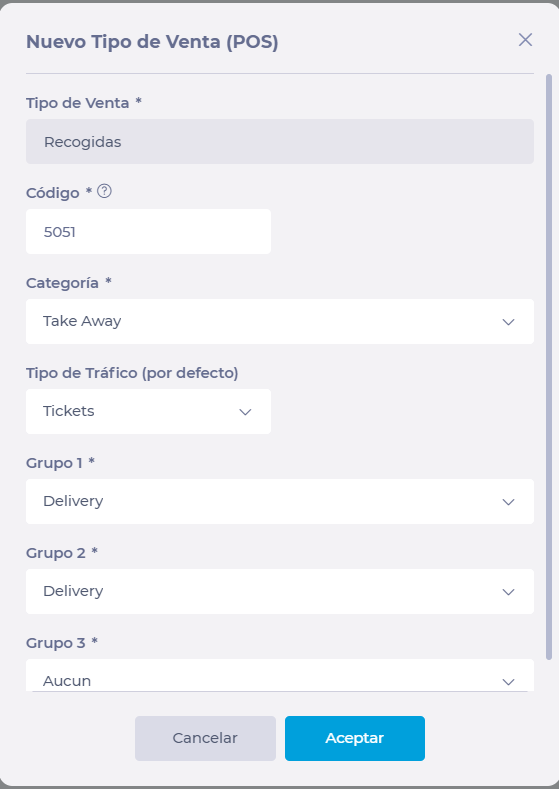
- Back in the New Sales Type (POS) window, assign values to the following fields:
- Code*
- Category*
- Traffic Type (by default)
- Groups (1, 2, and 3)*.
- Select Accept to save your new sale type OR Cancel to discard the configuration.
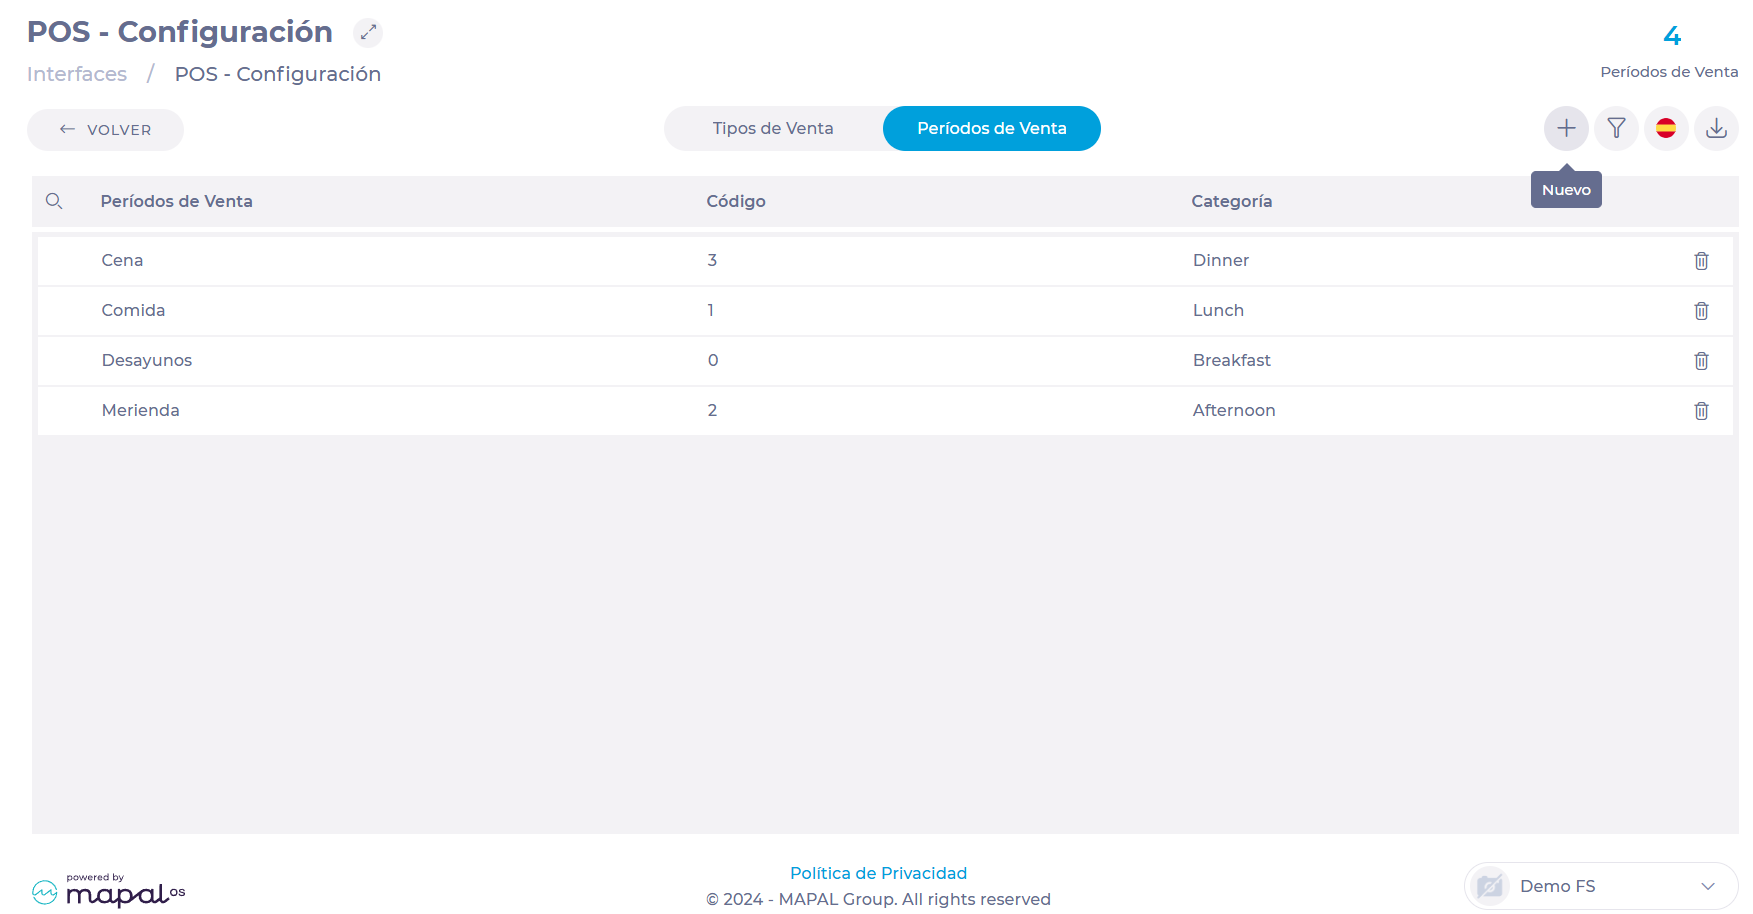
Sales periods
In this tab, you will find the sales periods previously configured in the POS.
To create a new sales period:
- Select New +.
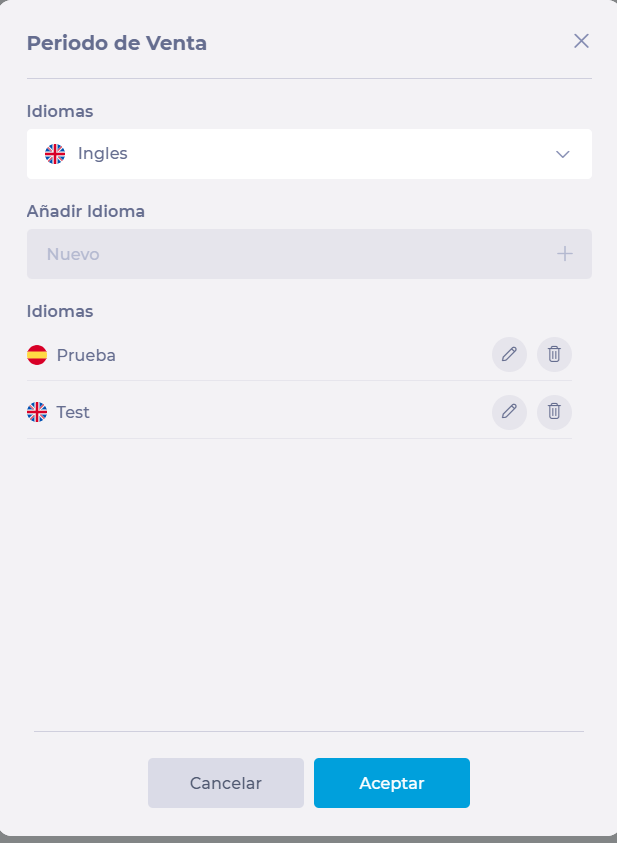
- Select the Sales Period field to assign a name and its respective translations.
- Select a language from the Language drop-down list.
- Assign a name in the text field and select Add +.
- Select Accept to save the name and translations of your new sales period.
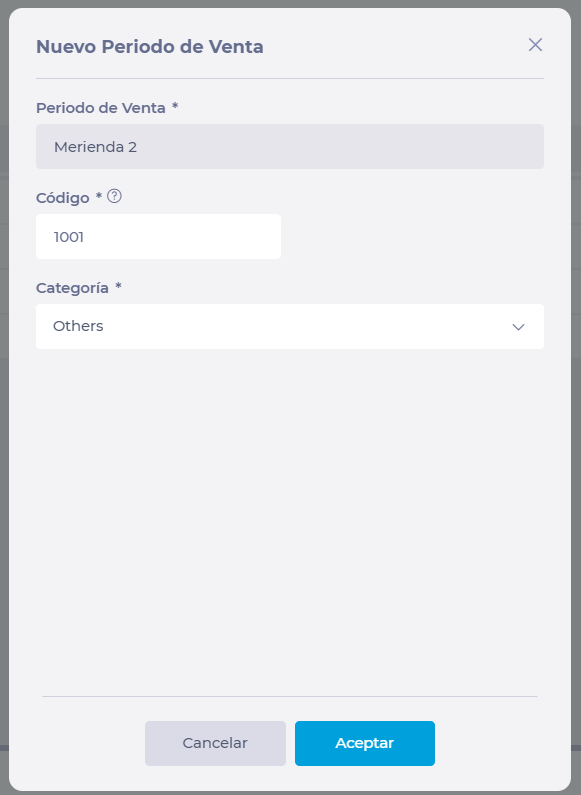
- Back in the New Sales Period window, assign values to the following fields:
- Code*
- Category*
- Select Accept to save your new sales period OR Cancel to discard the configuration.

Notes: All creations and modifications to sales types and periods have to be made also directly in the POS so that it synchronizes with the system. GIR extracts the POS data to be used in the system's budget configuration later. The data in the system and the POS must always match to maintain a faithful record and optimal performance.
Manage sales types and periods
To learn more about sales types and periods, see Understand sales types and periods.
Start from: The Analytics module.
-
Navigate to Configuration > POS - Configuration.
Notes: All modifications to sales types and periods must also be made directly in the POS. To edit parameters such as the name and code of the Sales Types and Periods, it is necessary to go directly to the POS configuration. GIR extracts the POS data to be used in the system's budget configuration later. The data in the system and the POS must always match to maintain a faithful record and optimal performance.
Manage sales types
Create a sales type
-
On the POS - Configuration screen, select the Sales Types tab.
-
Select the + New button to add a new sales type.
-
In the New Sales Type (POS) window, fill in the following fields:
-
Sales Type: Select the field and assign the name to the new sales type in all applicable languages. Press Accept to continue with the configuration.
-
Code: Assign the code that corresponds to this sales type according to the POS.
Notes: The sales import service will only allow sales data from POS for which Sales Type codes match with the ones configured.
-
Category: Assign a category from the drop-down list.
-
Traffic Type (default): Assigns a traffic to the sales type, which can be by guests or tickets.
-
Groups: Assign specific groups to the sales type you are creating.
Notes: To configure the groups, go to Configure Sales Type Groups below in this same article.
-
Once you have filled in all the fields, select Accept to complete the creation of your new sales type.
Change sales type
-
In the Sales Types tab, select the row of the sales type you want to modify.
-
A pop-up window will appear where you can edit the following fields:
-
Sales Type Name (in all languages)
-
Category
-
Type of traffic
-
Groups (1, 2 and 3)
-
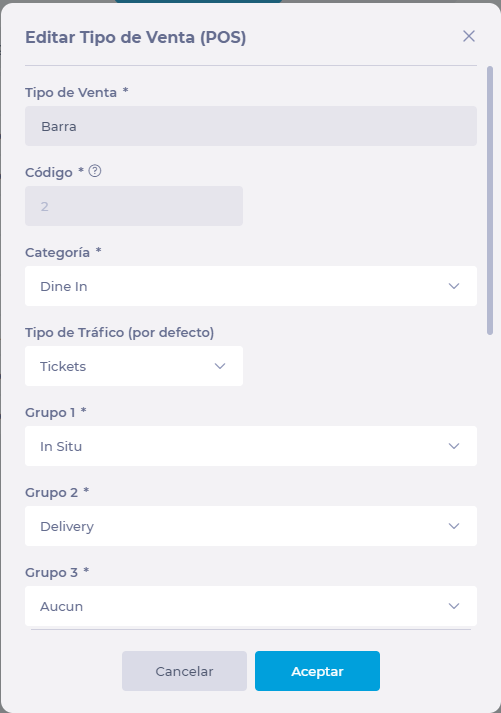
Notes: The code is already associated with a sales type in the POS, so it cannot be changed.
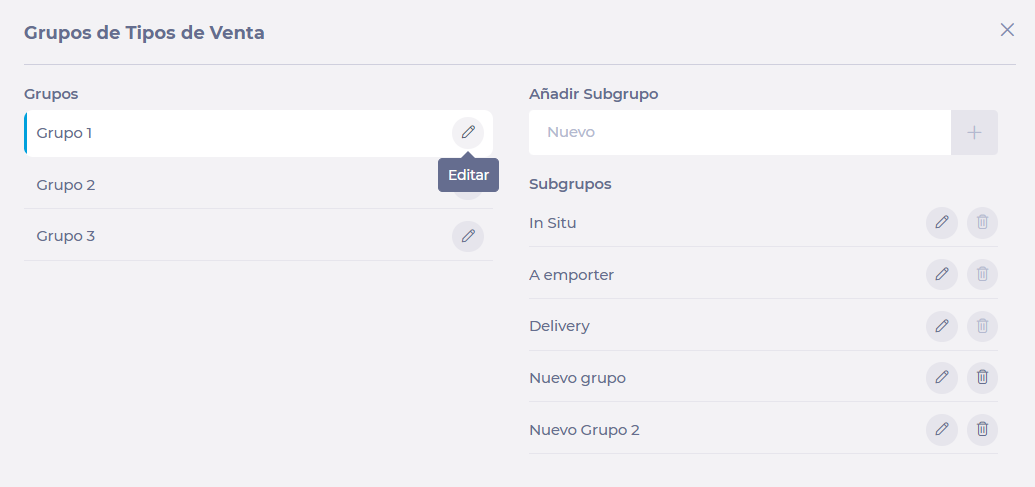
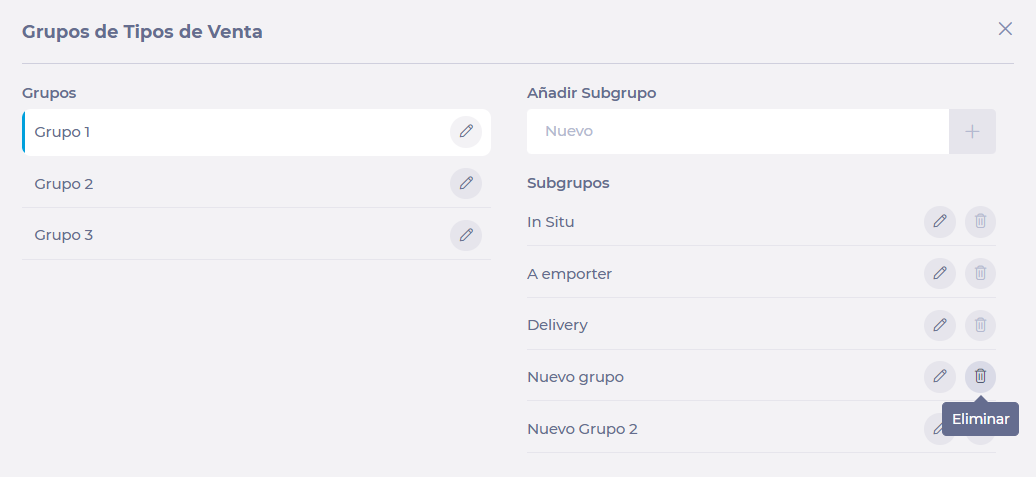
Configure Sales Type Groups
-
On the Sales Types tab, select Sales Types Groups Setup.
-
In the popup window, you will see the three (3) available groups and, by selecting them, you will also see their respective subgroups.
-
Select Edit in the row of a group or subgroup to change the names.
-
You can create new subgroups within a group by filling in the Add Subgroup field and selecting + Add.

-
Select Delete in the row of a subgroup to delete it.
Notes: Only subgroups can be deleted, as groups are three by default.
Manage sales periods
Create sales period
-
On the POS - Configuration screen, select the Sales Periods tab.
-
In the New Sales Period window, fill in the following fields:
-
Sales Period: Select the field and assign the name to the new sales period in all applicable languages. Press Accept to continue with the configuration.
-
Code: Assign the code that corresponds to this sales type according to the POS.
-
Notes: The sales import service will only allow sales data from POS for which Sales Period codes match with the ones configured.
-
Category: Assign a category from the drop-down list.
-
Once you have filled in all the fields, select Accept to complete the creation of your new sales period.
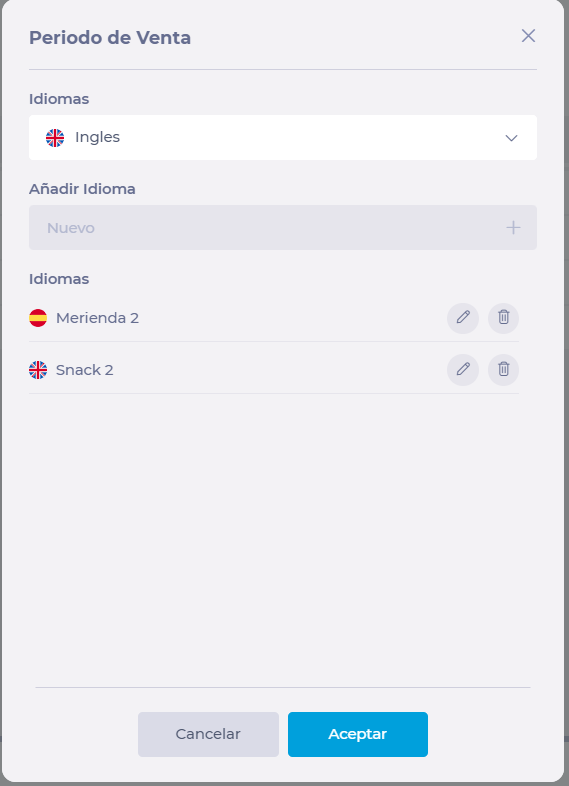
Change sales period
-
In the Sales Periods tab, select the row of the sales period you wish to modify.
-
A pop-up window will appear where you can edit the following fields:
-
Sales Period Name (in all languages)
-
Category
-
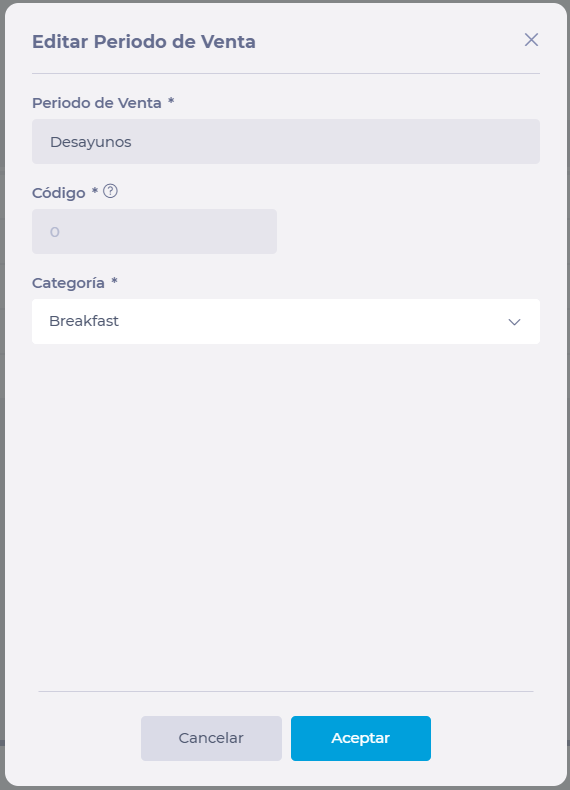
Notes: The code is already associated with a sales period in the POS, so it cannot be changed.
Run Workforce on a web browser
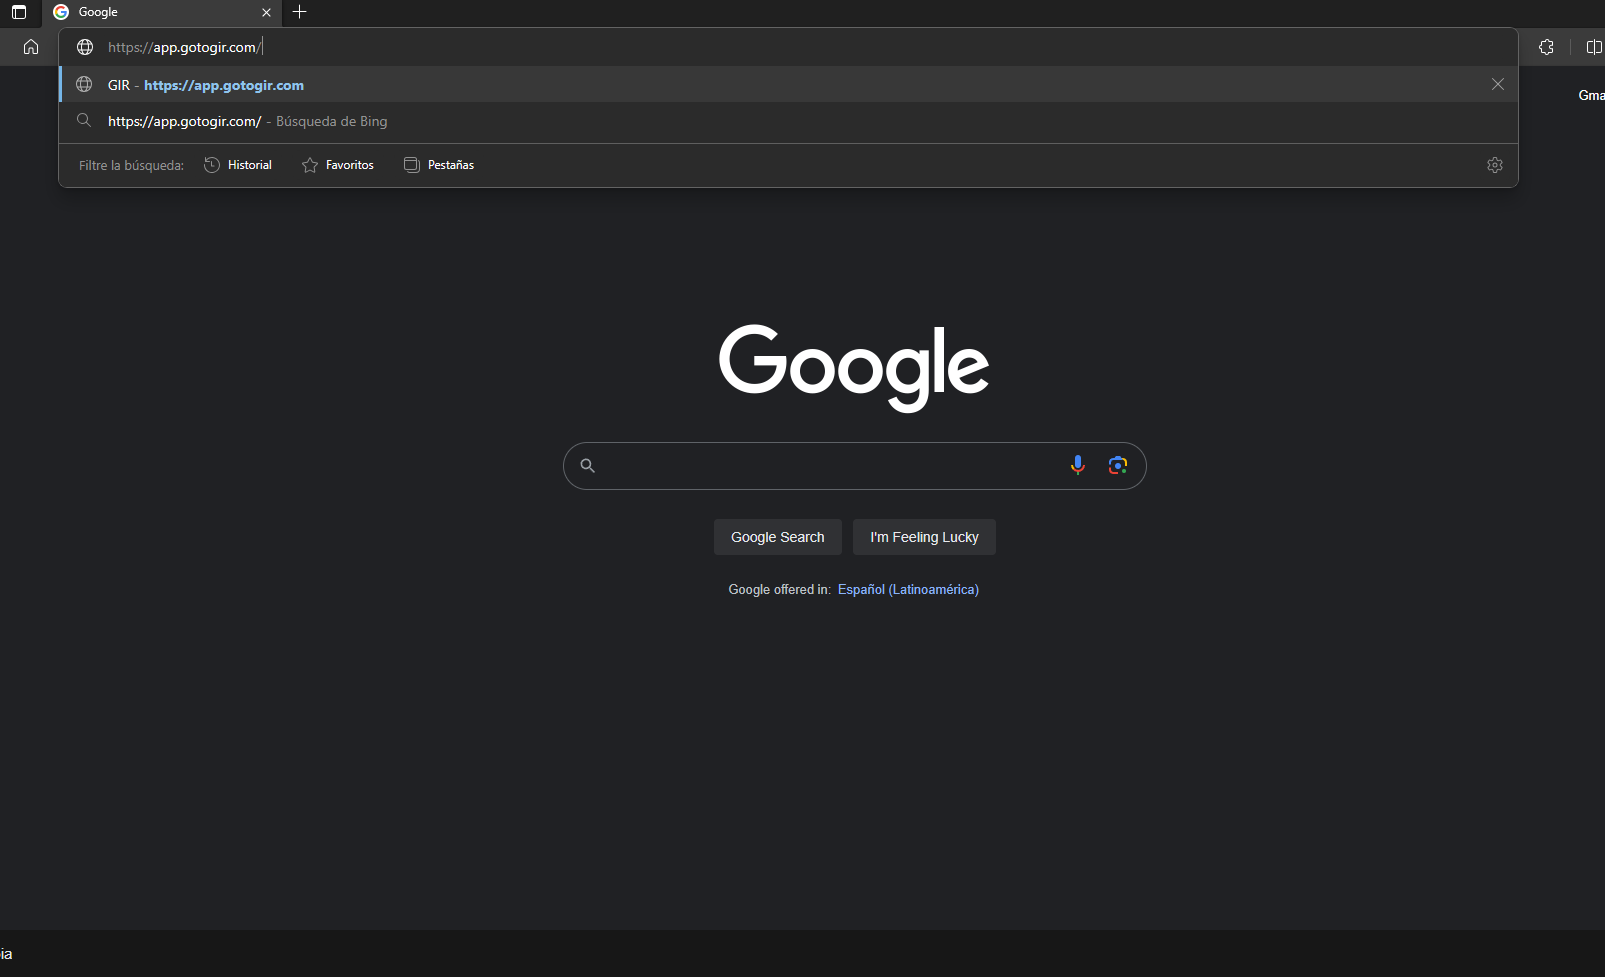
Start from: Your web browser (Google Chrome, Mozilla Firefox, Microsoft Edge).
- Type https://app.gotogir.com/ in your browser's toolbar and press Enter.
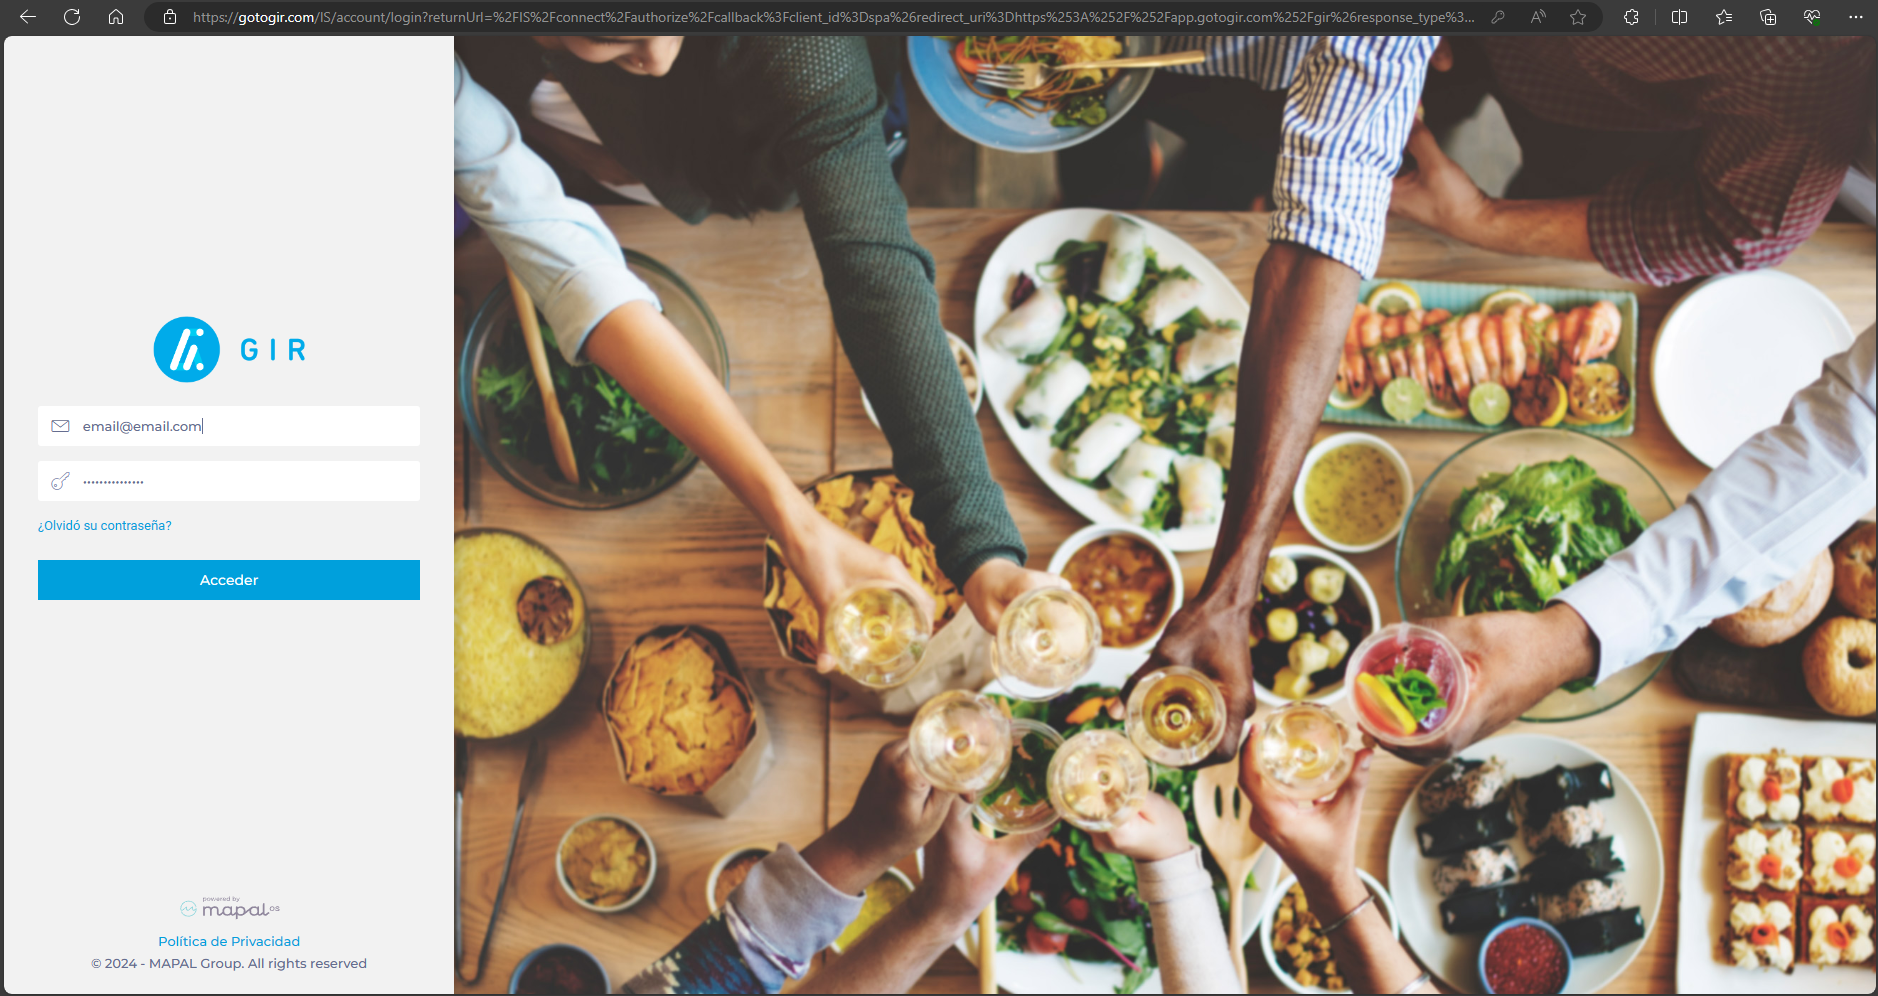
- On the login screen, enter the Email and Password assigned to your account.
- Click on the Access button.
Notes: If you have problems with your password, select Forgot your password? on the login screen.
- Once inside your account, select the application icon to display all available applications.
- Select the Workforce icon to access the tool.
System requirements
Workforce can perform well on any laptop or desktop computer with standard performance specifications. The operating system can be any operating system (Windows, Mac OS, Linux), as long as it has an up-to-date web browser.
The recommended browser for the application is Google Chrome. It can also perform well in browsers such as Microsoft Edge and Mozilla Firefox.
The use of the Safari browser is not recommended, since there have been errors and fluidity problems with this browser
Compare cash sheets sales with POS
Start from: The Analytics module.
Create analytics
Before creating the dashboard with the comparison, you will have to configure the Scenarios to be visualized; in this case, the sales recorded in POS and the Cashrec. At this point, you must establish the parameters (timeline, data source, center, types, and sales periods, among others) for the analytics.
This procedure must be done twice, once for each Scenario (POS and Cashrec).
To configure the parameters:
-
Select Sales from the main menu.
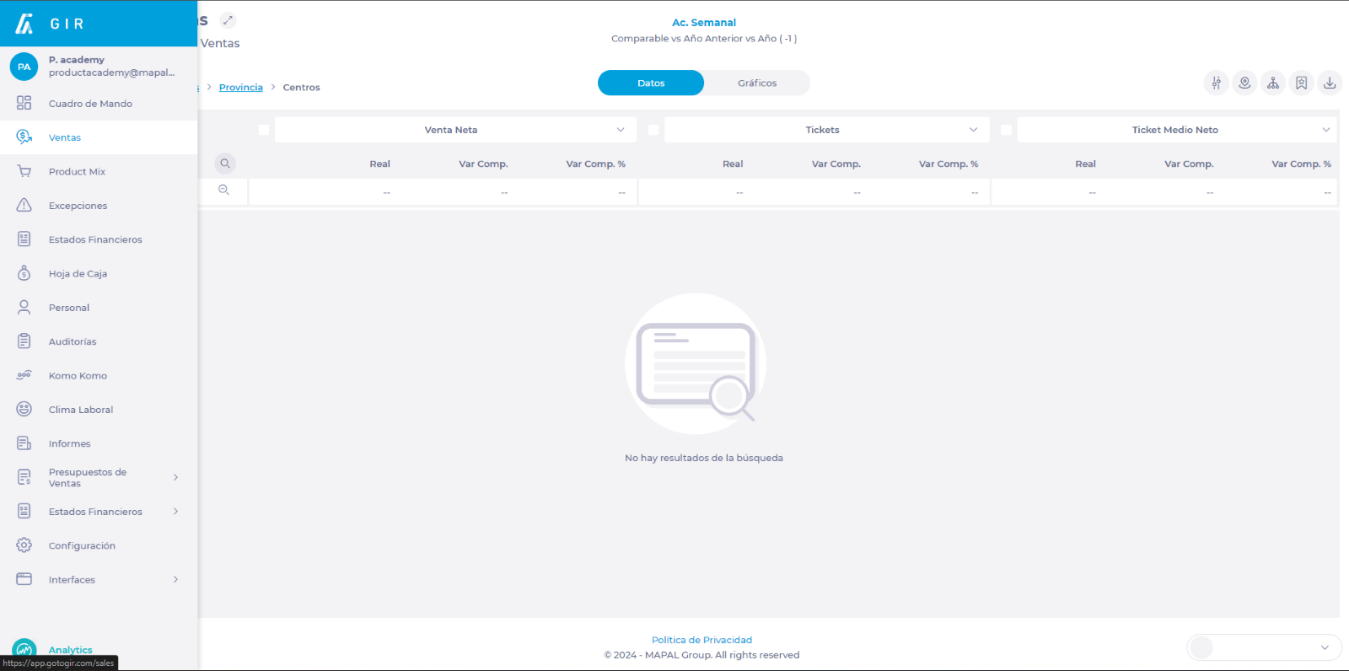
-
Select the Parameters button.
-
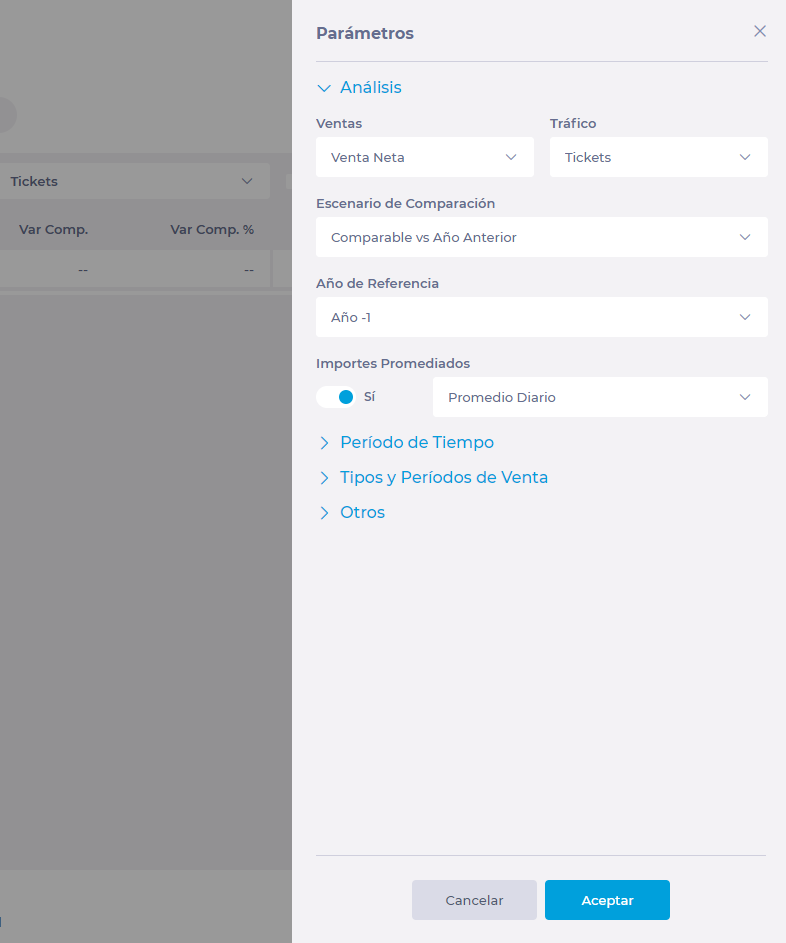
In Analysis, you can establish:
-
If you want to display the Sales as Net Sales or Gross Sales.
-
If you want to see the Traffic by Checks or Guests.
-
The Comparison Scenario of the analytics can be Like for Like, Actual vs Previous Year, Actual vs Budget, Budget vs Last Year.
-
The Reference Year, which can be any of the last five (5) years.
-
If you wish to view Average Amounts, either daily, weekly, monthly or yearly.
-
In Period, set:
-
The Period you wish to view. You can view the last day, week, month, year or a specific date range you select.
-
If you wish to exclude or include specific days of the week.
-
If you wish to include Bank Holidays, Holiday Eves, Events, and Exclude outlier dates.
-
If you want to filter by Weather or Temperatures.
-
In Type and Sales Periods, configure:
-
If you wish to see Individual or Groups of sales types. Then, select the specific type or group of types from the dropdown.
-
If you wish to view one or all of the Sales Periods.
-
In Others, you can set parameters such as data source, currencies, percentage variations in local currency or ignore days without sales. At this point, you will set whether the data will come from the POS or from the Cashrec.
-
Once the setting is complete, select Accept to save it OR Cancel to discard it.
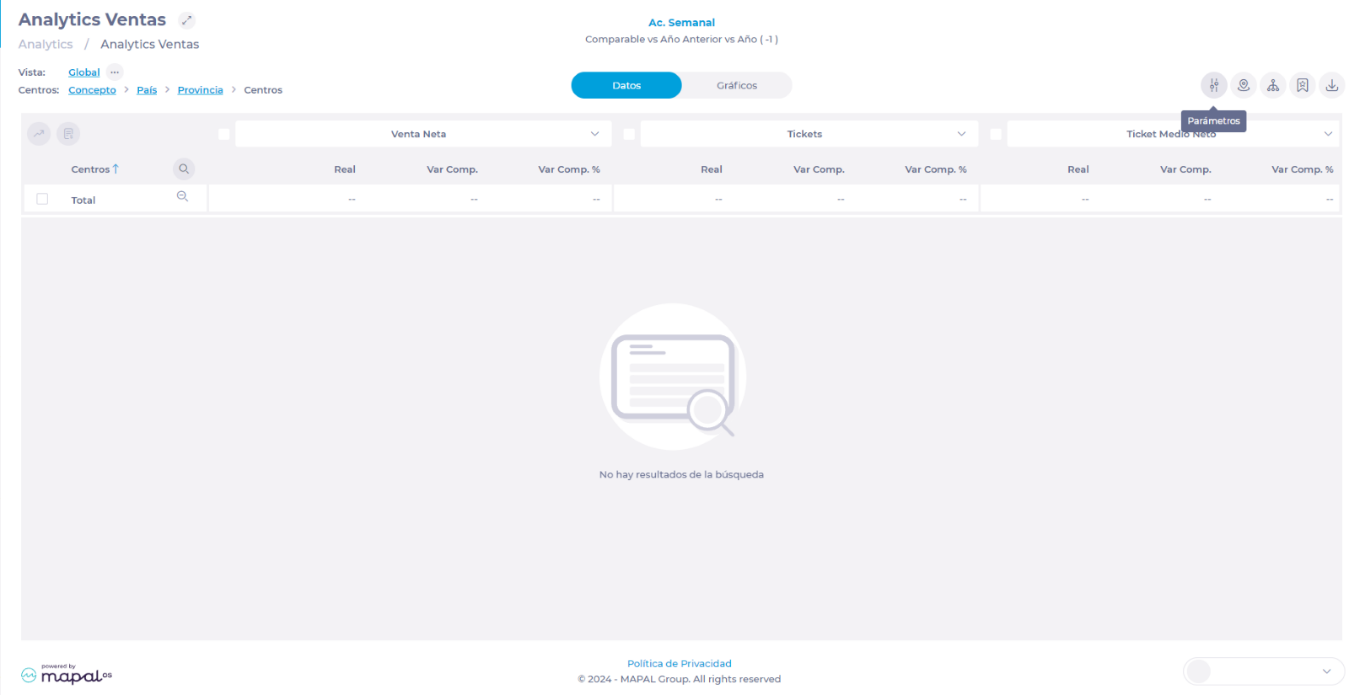
-
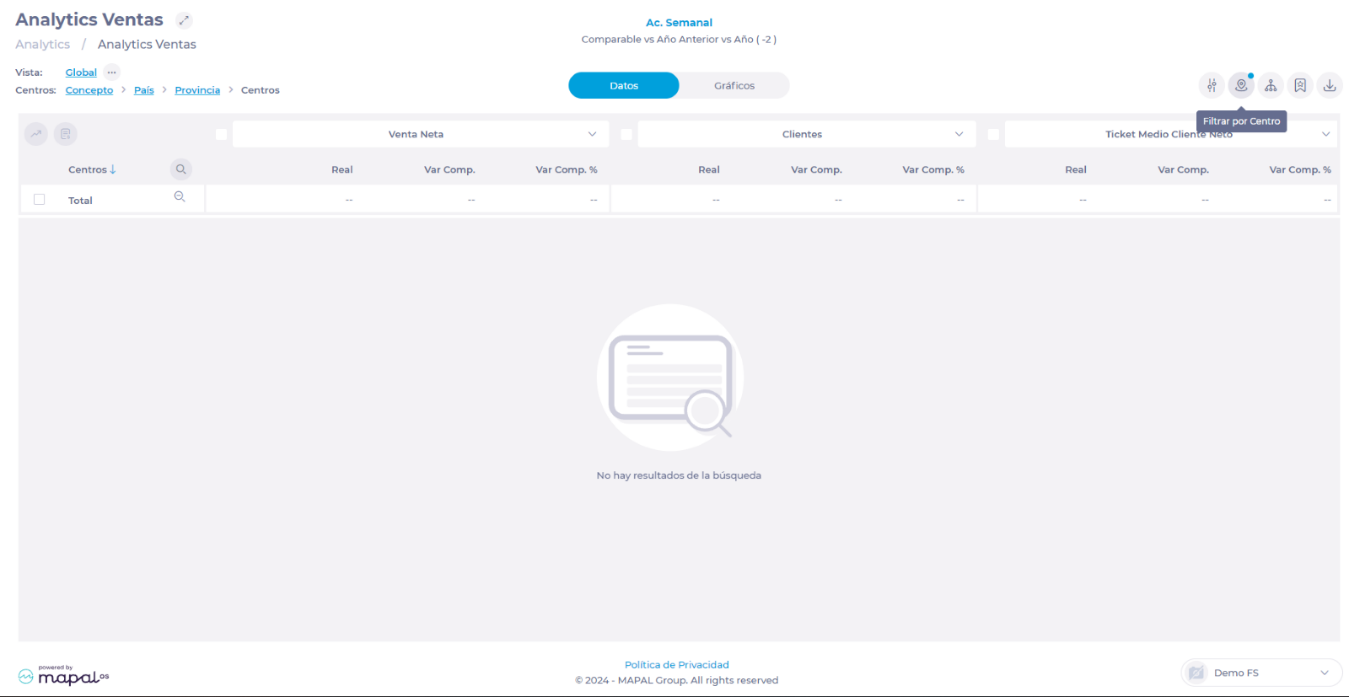
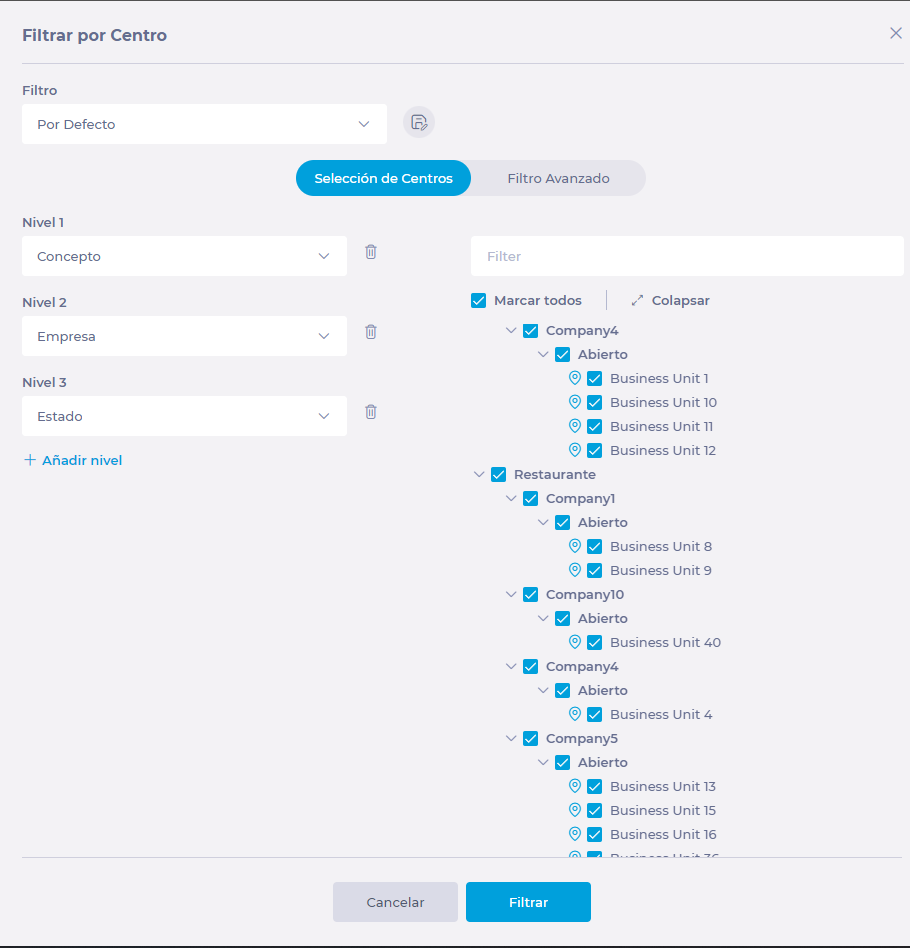
Back on the Analytics Sales screen, select Filter by Business Unit.
-
In this window, you can select the specific center or centers for which you wish to make the comparison.
-
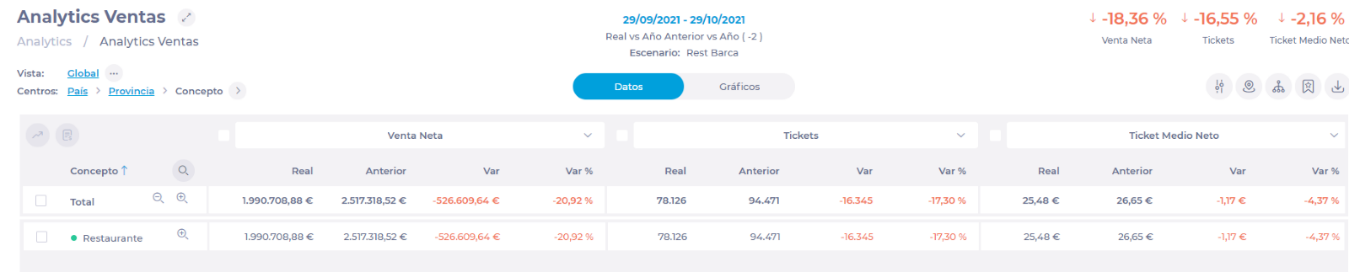
Once you have selected the center(s), the Sales Analytics screen will show you a list of the selected units with the data. In this screen you can take an overview of actual sales, past sales (based on the comparable year), and the variation in percentage and amounts.
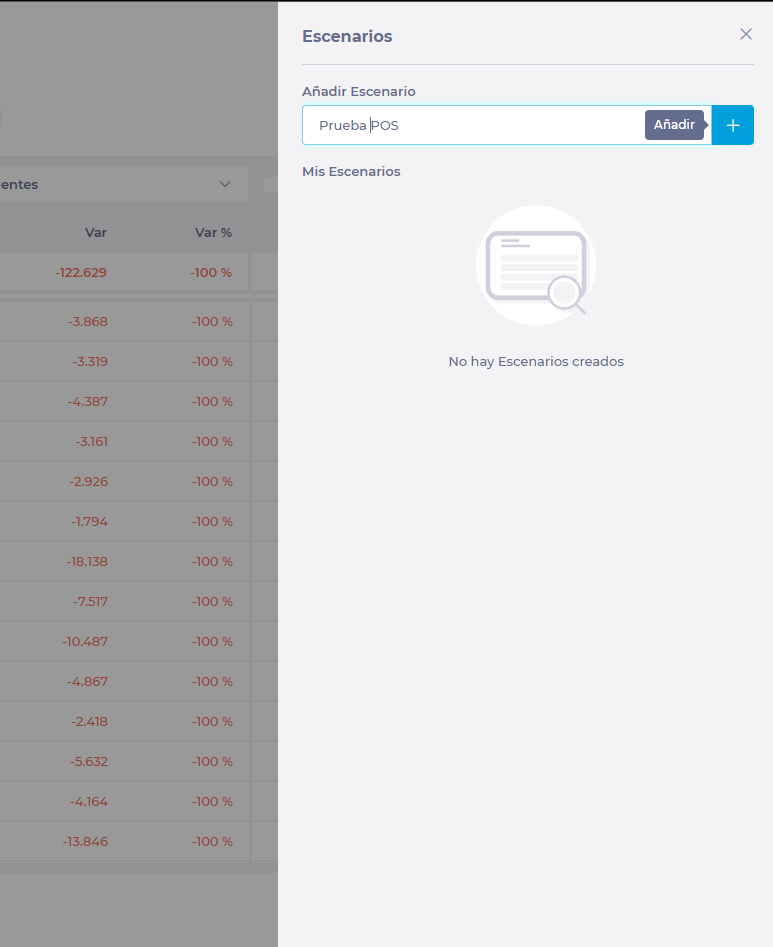
- You can save this scenario you have created by clicking the Scenarios button and assigning a name to it.
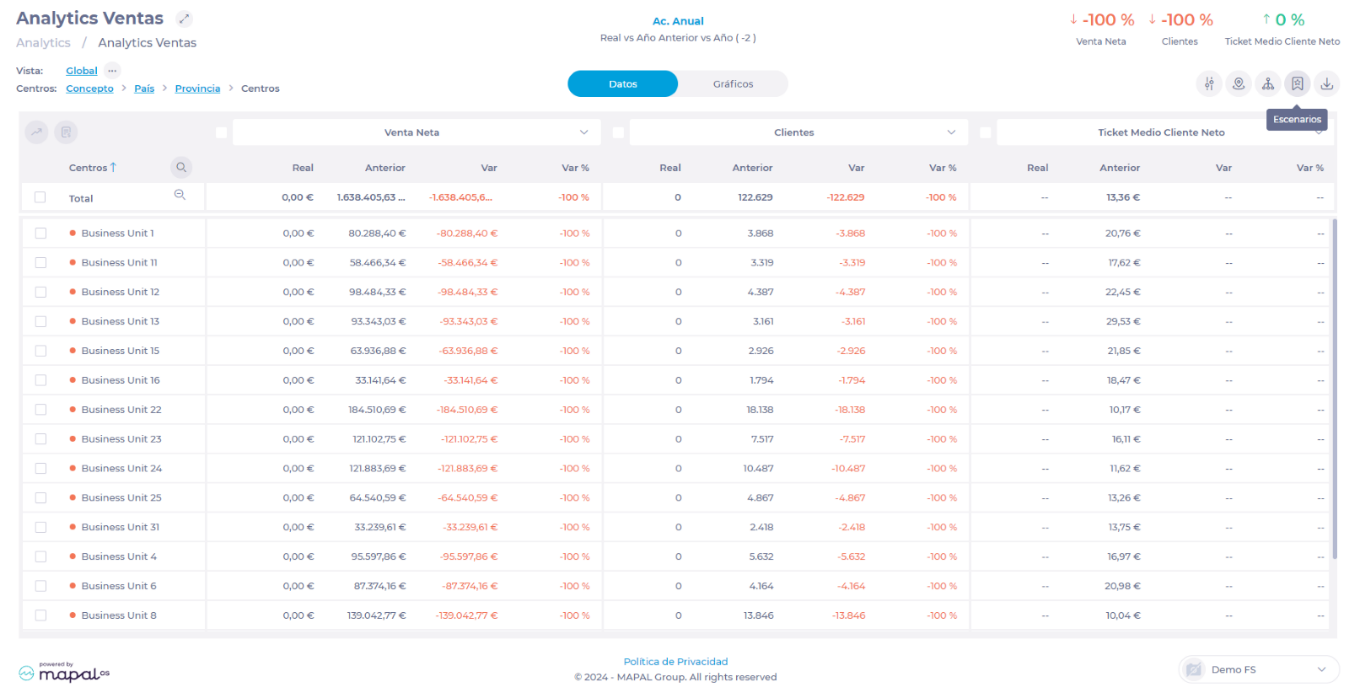
Notes: For an accurate comparison, all parameters should be configured the same in both scenarios, except the Data Source in the Other section, which will be Cash Sheet for one and POS for the other.
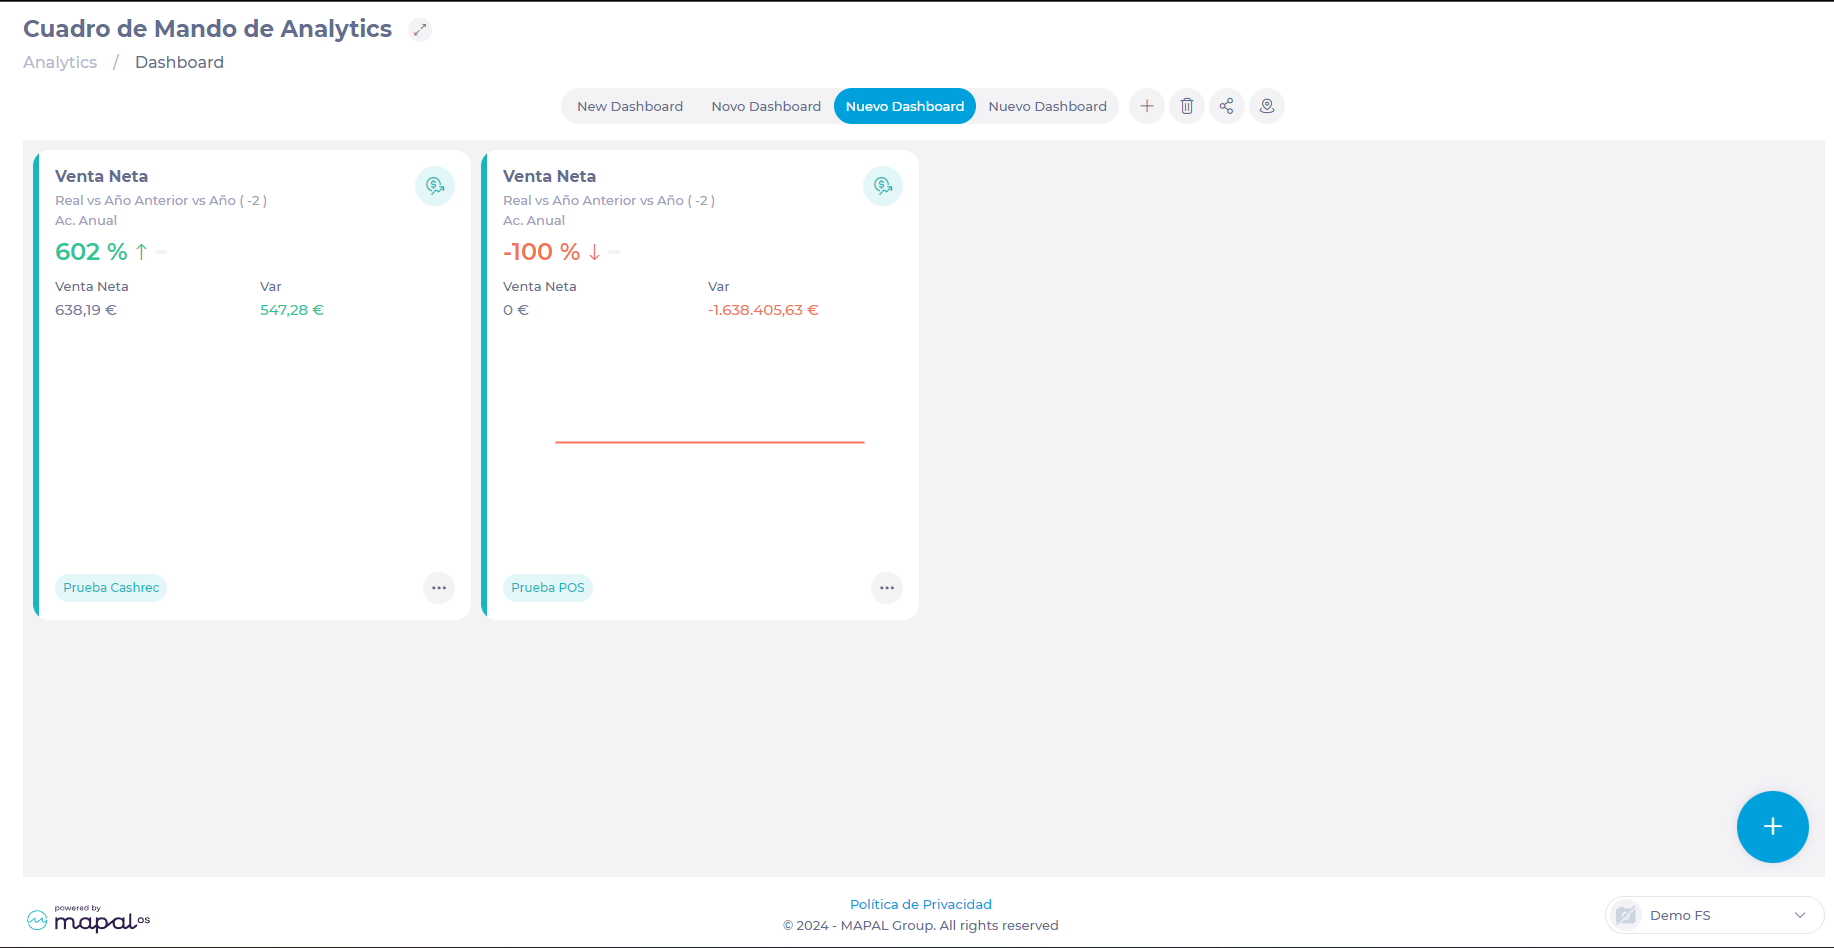
Create the dashboard with the comparison
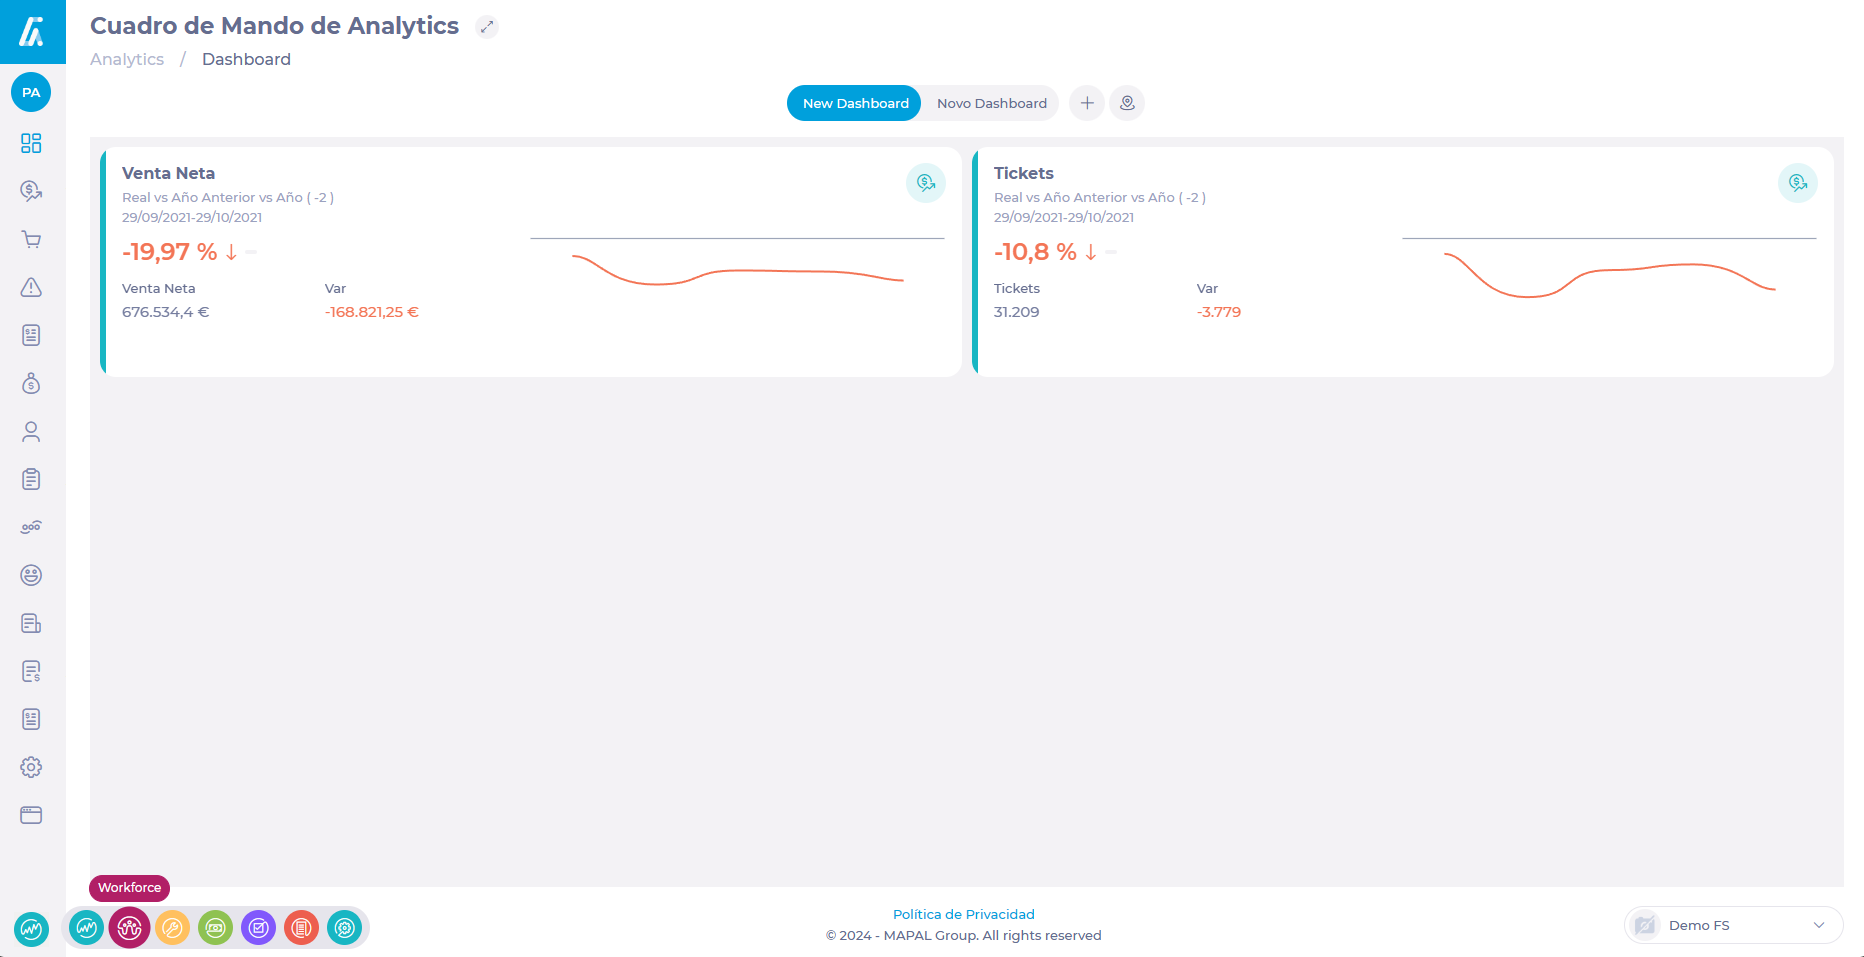
With the parameters configured and the scenarios saved, you can return to the analytics Dashboard to search for them and fix them in a Dashboard. This way you will be able to access this data easily and permanently.
To create the dashboard:
-
Select Dashboard from the main menu.
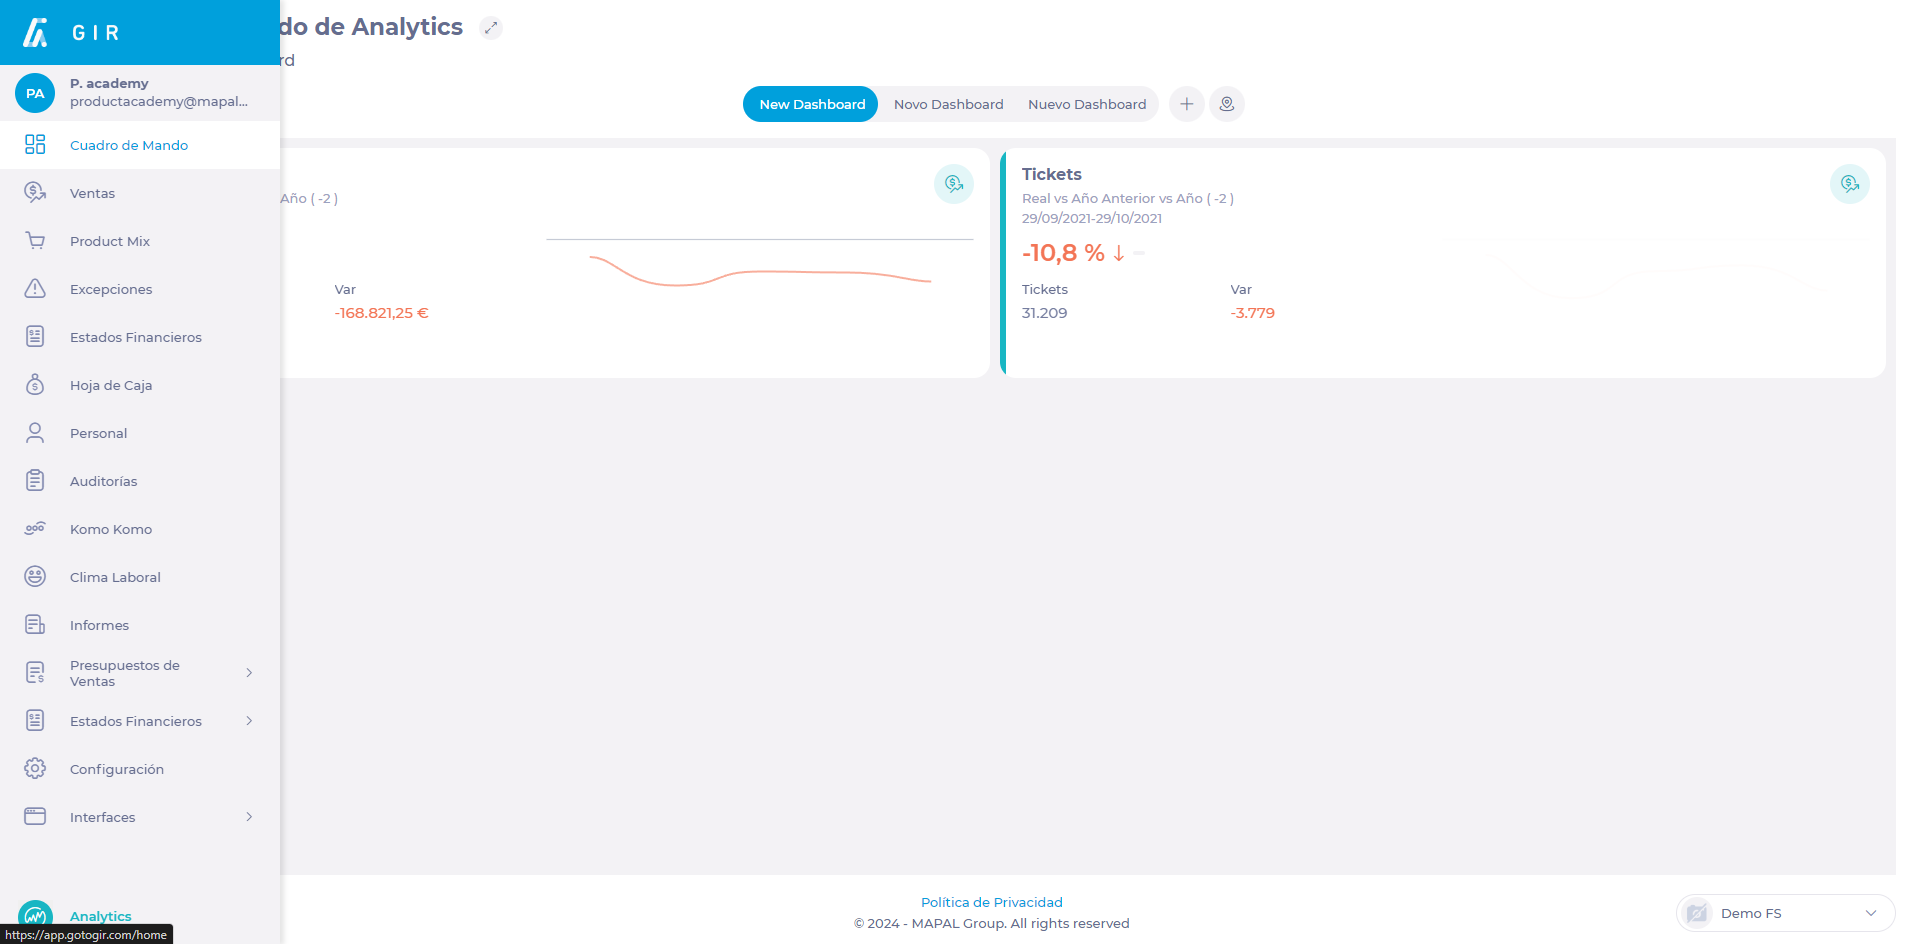
-
Select New + to create a new Dashboard.
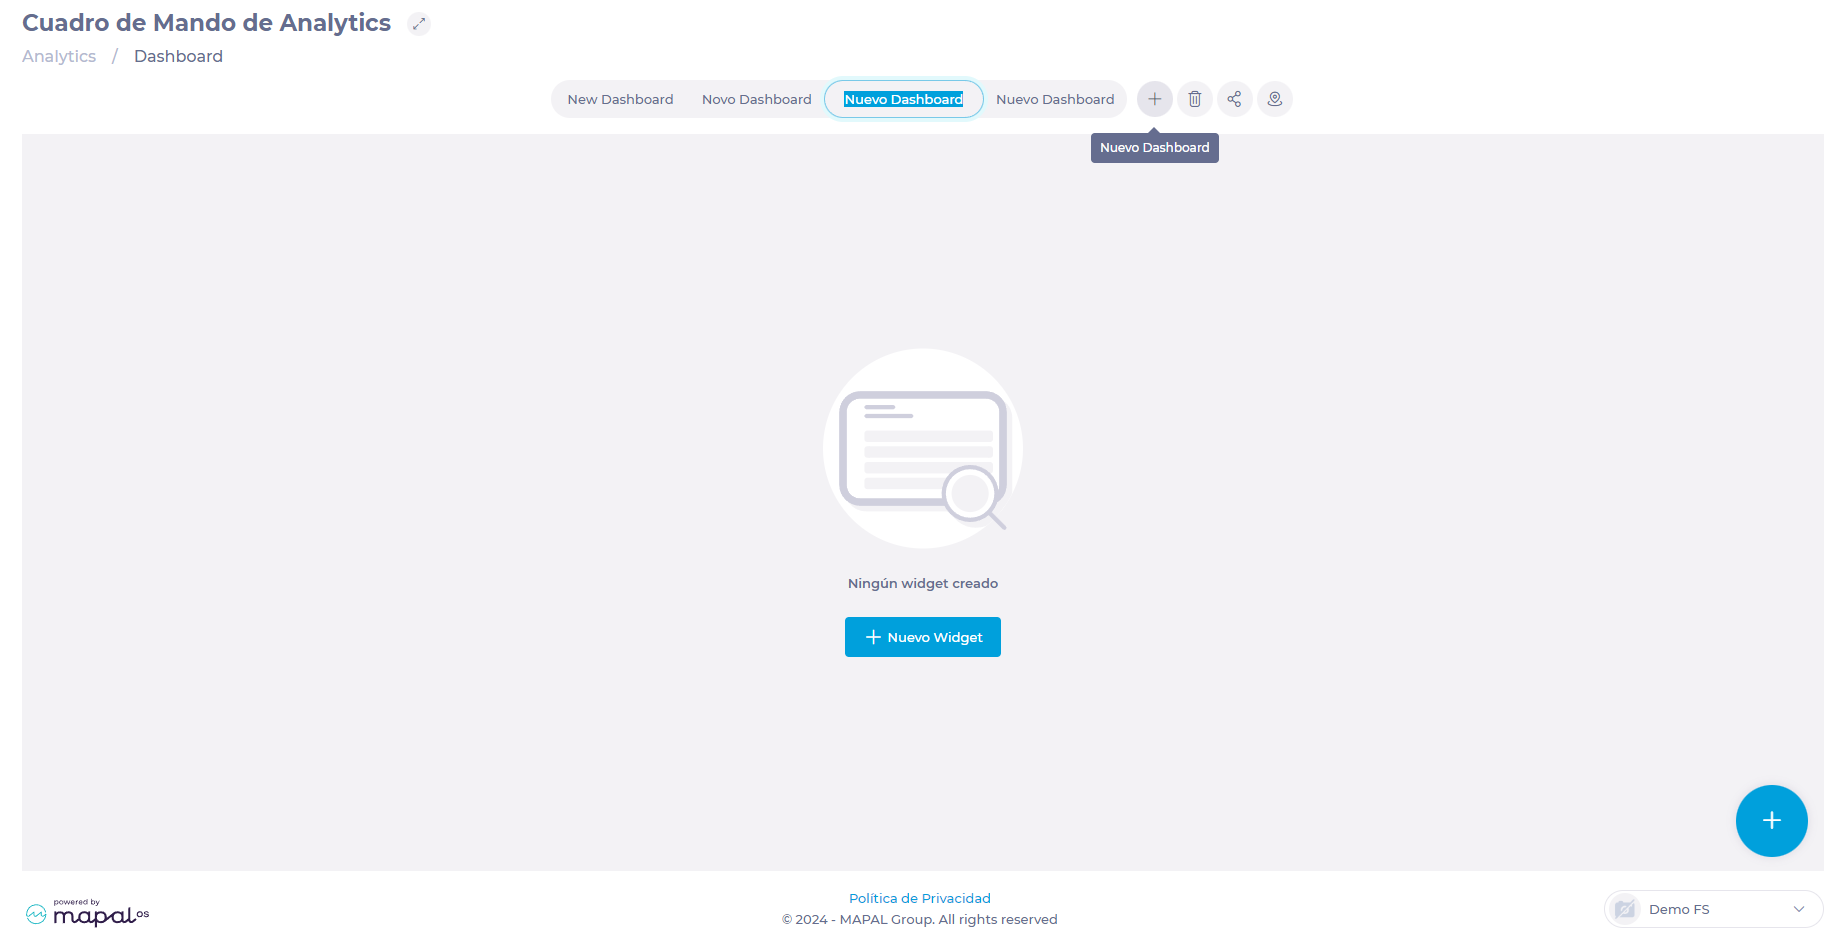
-
Assign a name to the new dashboard.
-
Select + New Widget.
-
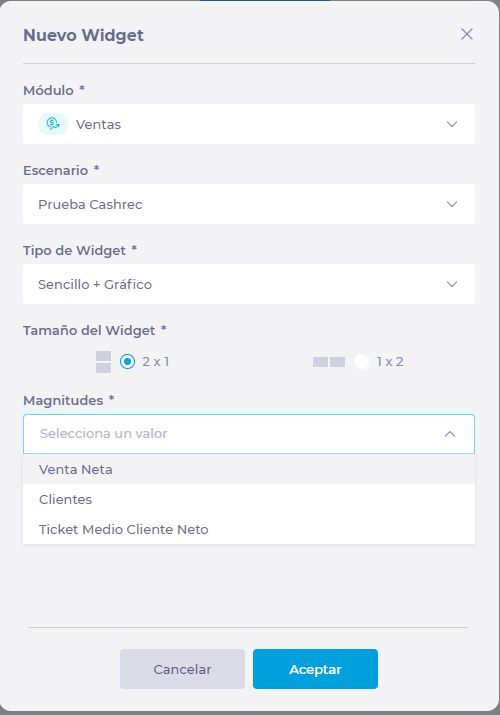
In the pop-up window, select the following parameters:
-
Module: Choose the Sales module.
-
Scenario: One of the scenarios you have created for this comparison.
-
Widget type: Simple (data only), Chart (graphs only), or Simple + Chart (data and graphs).
-
Widget size: if you want to display it in horizontal or vertical format.
-
Magnitudes: Select Net Sales to view specific differences related to sales.
-
-
Press Accept to save the widget OR Cancel to discard it.
-
Repeat this same procedure with the second scenario.
Once the widgets are configured, you will be able to access this visual easily in the dashboard you have created.