


Départ de : Le tableau de bord Analytics.
-
Accéder à Audits.
-
A grid will be displayed showing five key colums and their subcolumns:
-
Unité commerciale : Identifies the business unit being audited.
-
Score: Provides an overall performance evaluation based on audit results.
-
Score: The total score achieved in the audit.
-
Scale: The grading scale used for evaluation.
-
Number of Audits: The total audits conducted within the selected timeframe.
-
-
Consistency: Measures the reliability of audit scores over time.
-
Minimum: The lowest recorded score.
-
Maximum: The highest recorded score.
-
Consistency: The variance between audit scores, indicating stability.
-
-
Pain Points: Highlights critical areas requiring attention.
-
Score: The aggregated score for identified weak areas.
-
-
Actions: Tracks the status of corrective measures derived from audits.
-
Number: Total corrective actions logged.
-
En attente: Actions that require follow-up.
-
Completed: Successfully resolved actions.
-
Completed %: The percentage of completed corrective actions relative to the total.
-
-

-
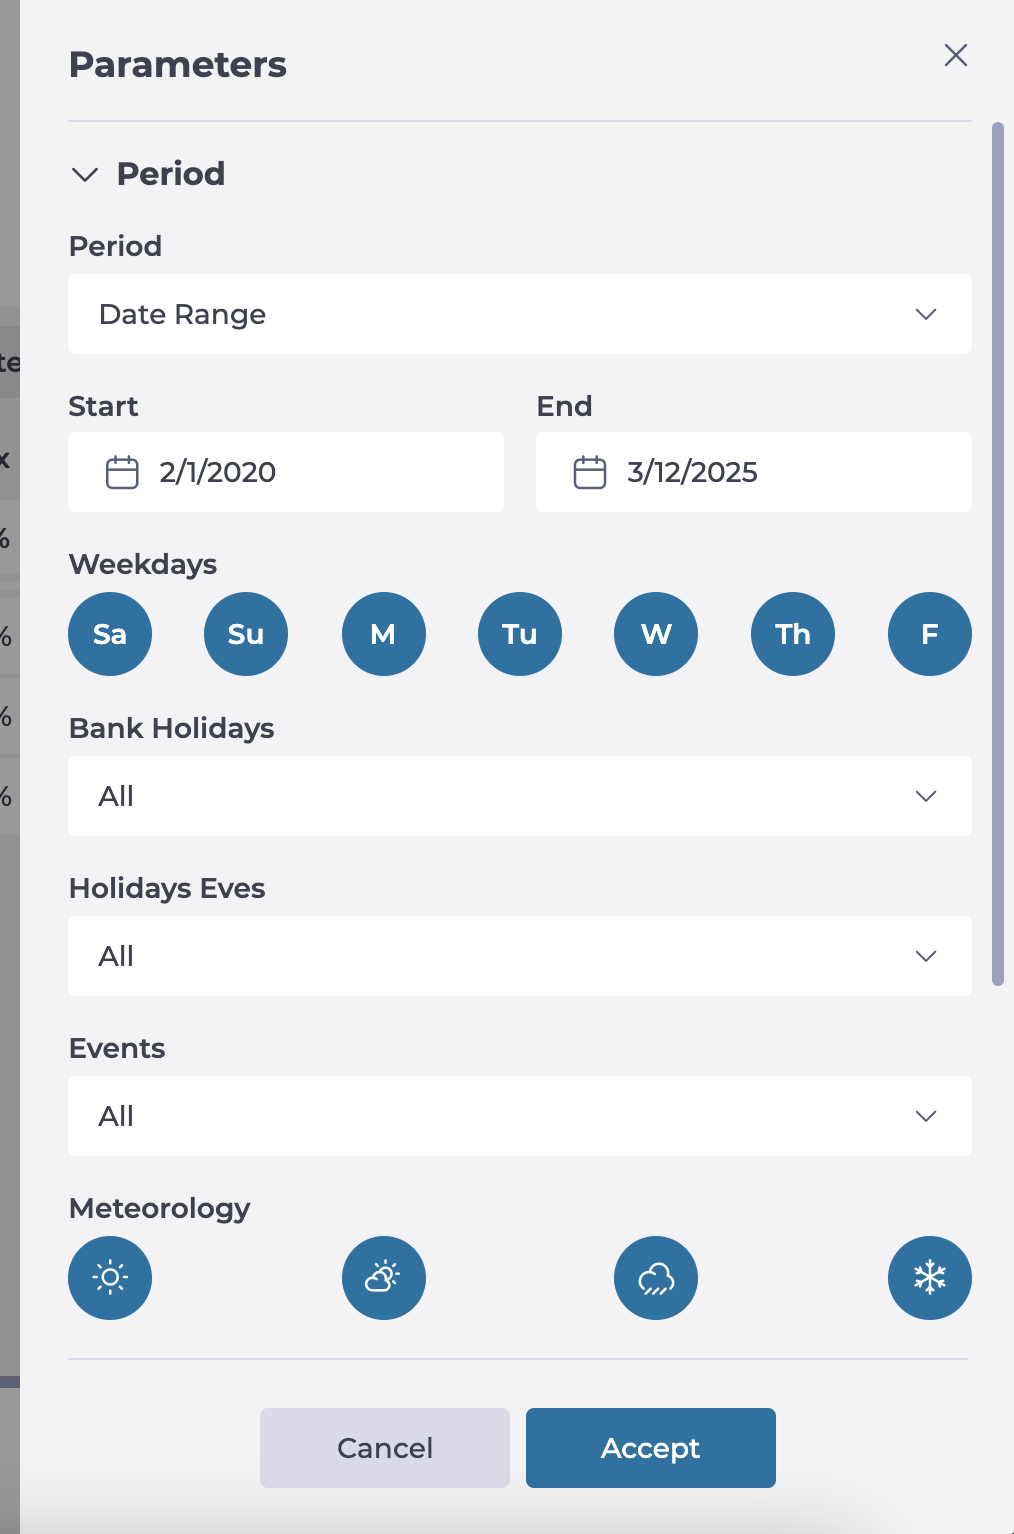
Utilisez le Paramètres panel to adjust the view to match your needs. Here, you can:
-
Select specific Audits to see.
-
Ensemble Analyse types.
-
Select specific Groupes, Subgroups, or Assessed Points to include.
-
Sélectionnez le spécifique Période you want to see.
-
-
Once parameterized, you will be able to see the refined information in the grid.
-
Vous pouvez également utiliser le Filter By Business Unit to see the info by specific centers.

-
You can now switch views between tabular format et graphical representation to facilitate interpretation, according to your preferences and needs.
