


Départ de : Le tableau de bord d'apprentissage Flow.
-
Sélectionner Rapports depuis le menu principal.
-
Sélectionner Compliance Overview from the list of reports.
You will now be able to view your Compliance data as a chart. Use the Grouper par dropdown to customise the view.

Saving filter presets
-
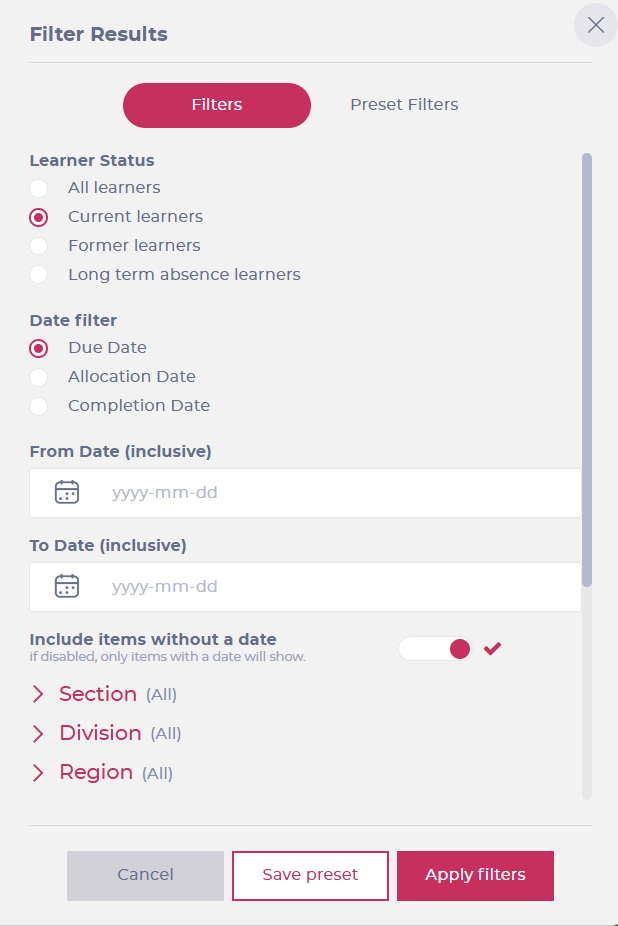
Sélectionner Filtre to configure the data to be shown in the report, such as learner statuses, dates, regions, departments, etc. You can adjust the report as desired.
-
Once you have adjusted the filters, you can save the configuration by selecting the Save preset bouton OU moving to the Preset Filters languette.
-
Once in the Preset Filters tab, enter a name for the preset in the text field and select the checkmark ? pour le sauver.

You can delete the presets later if they are no longer needed. To do this, select the Supprimer button next to the saved preset.

Exporting the compliance report
Sélectionnez le Exporter icon and choose from the following export options:
- Export Data to CSV
- Export Chart to CSV
- Export Chart to PDF
- Export Chart to JPEG
Once the export is initiated, the CSV file is downloaded to your local device.
The three "Export Chart to..." options show the overview data, while the "Export Data to CSV" option details the progress of every learner (depending on how you've set up the report).