

Start from: The Cashrec home screen.
Cash Differences dashboard
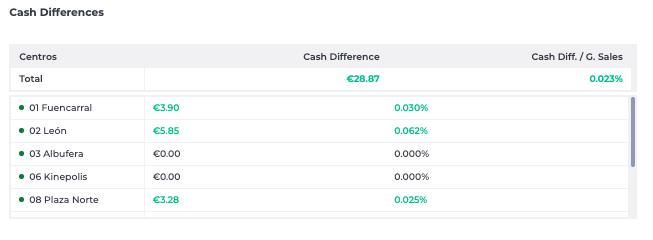
Use the Cash Differences widget to monitor gaps between expected and counted cash by store.
This dashboard shows:
- Cash short: Negative discrepancies where less cash was found than expected.
- Excess: Positive discrepancies where more cash was found than expected.
- Cash difference: The net result of shorts and excesses.
Visualisation
- Line and bar charts present the daily evolution of differences per site.
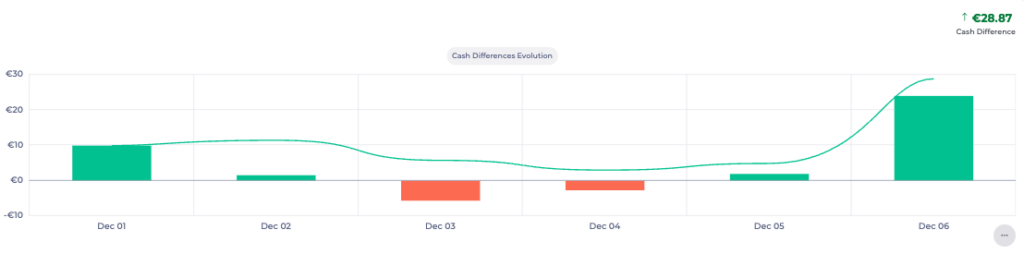
How to use it
- Positive values indicate overages that may need explanation.
- Negative values highlight shortages that require investigation and follow-up.
- Repeated patterns over time can indicate process issues (for example, counting errors or handling problems) at specific stores.
Means of Payment dashboard
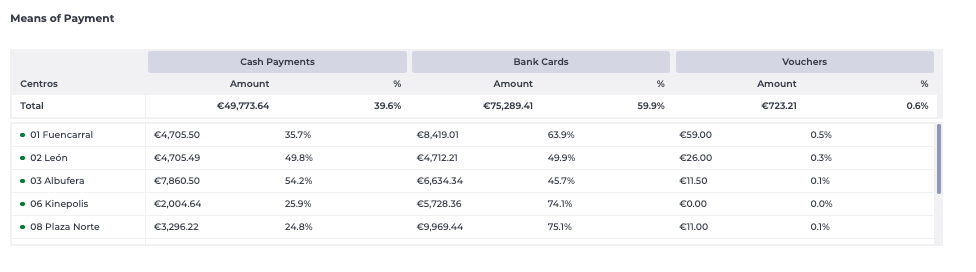
Use the Means of Payment widget to review how sales are distributed across payment methods.
This dashboard shows:
- Cash payments: Total revenue taken in cash.
- Bank cards: Total card transactions.
- Vouchers: Payments made with meal vouchers or similar instruments.
Visualisation
- A comparative table shows amounts and percentages by method.
- A line chart displays the evolution of each payment method over time.
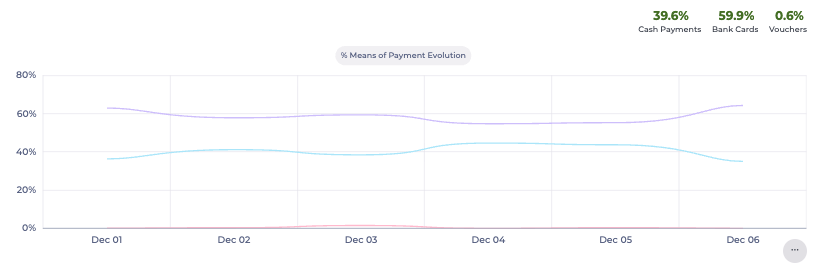
How to use it
- Check whether the distribution of payment methods matches expectations for each site or trading period.
- Compare the values against point-of-sale (POS) reports to confirm that Cashrec and POS data are aligned.
- Monitor changes in payment behaviour (for example, a shift from cash to card) that may affect cash handling routines.
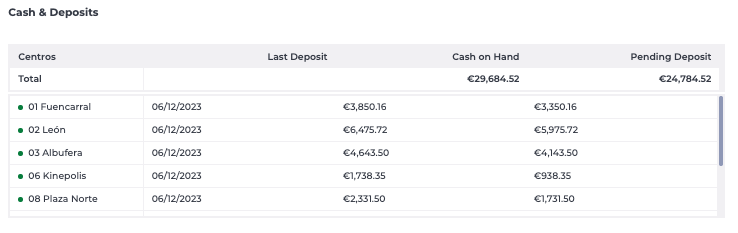
Cash & Deposits dashboard
Use the Cash & Deposits widget to track cash still on hand and deposits made to the bank.
This dashboard shows:
- Last deposit: The date and amount of the last deposit recorded for each store.
- Cash on hand: The current cash held at the location.
- Pending deposit: Cash not yet deposited.
Visualisation
- An area chart shows deposit and cash levels over the selected period.

How to use it
- Check that deposits are made regularly and in line with company policy.
- Identify stores with high pending deposit amounts that may need action.
- Use the last deposit date to ensure that sites are not holding cash for longer than allowed.
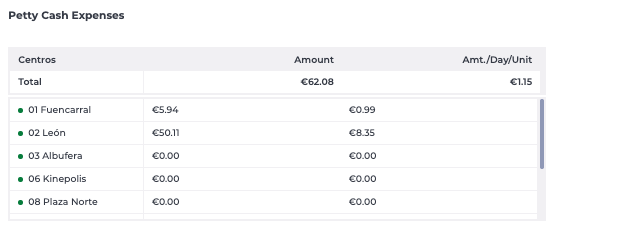
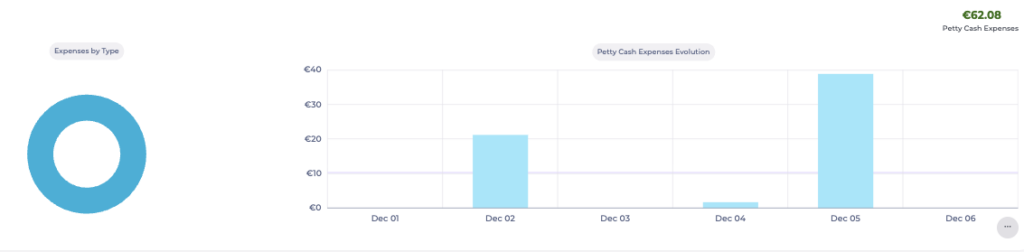
Petty Cash Expenses dashboard
Use the Petty Cash Expenses widget to review small operational costs paid directly from the till.
This dashboard shows:
- Petty cash spend per store.
- Total petty cash used in the selected period.
Visualisation
- A bar chart displays petty cash usage over time.
How to use it
- Monitor which stores use the most petty cash and for what level of spend.
- Support cost control by identifying unusual or sustained high petty cash usage.
- Use in combination with local procedures to confirm that receipts and justifications are in place.
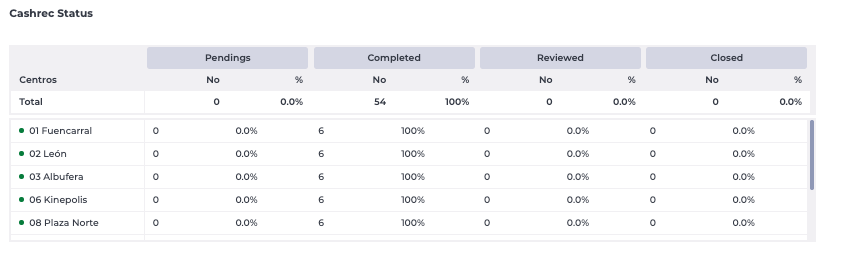
Cashrec Status dashboard
Use the Cashrec Status widget to follow the completion status of cash sheets by store.
This dashboard shows, for each store:
- Pending: Sheets not yet completed.
- Completed: Sheets entered but not reviewed.
- Reviewed: Sheets checked and validated by office or central staff.
- Closed: Sheets officially closed and locked.
Visualisation
- Tables and pie charts summarise the status distribution per store.
How to use it
- Confirm that all locations complete their daily cash sheets.
- Identify stores with many Pending or Completed sheets that still require review or closure.
- Support end-of-period controls by ensuring all weeks are fully Closed before payroll or accounting deadlines.
Filters on the Cashrec home screen
The Cashrec home screen includes filters accessed via the filter icon in the top right-hand corner.

You can use these filters to:
- Select the business units you want to see data for, so dashboards only show the chosen locations.
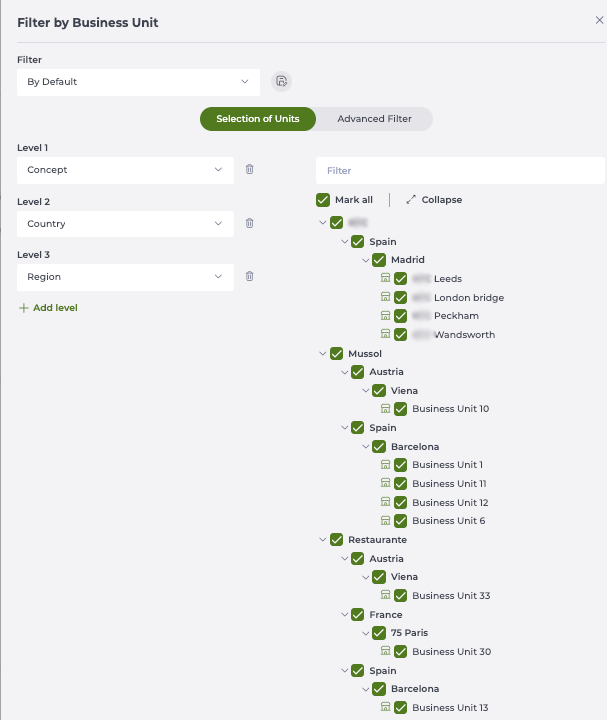
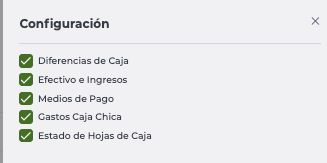
- Select which dashboards you want to display on your home screen.
The filter and dashboard selections are stored at user level and will be remembered in future sessions, so you do not need to reconfigure them each time you log in.