


Start from: The Analytics dashboard.
-
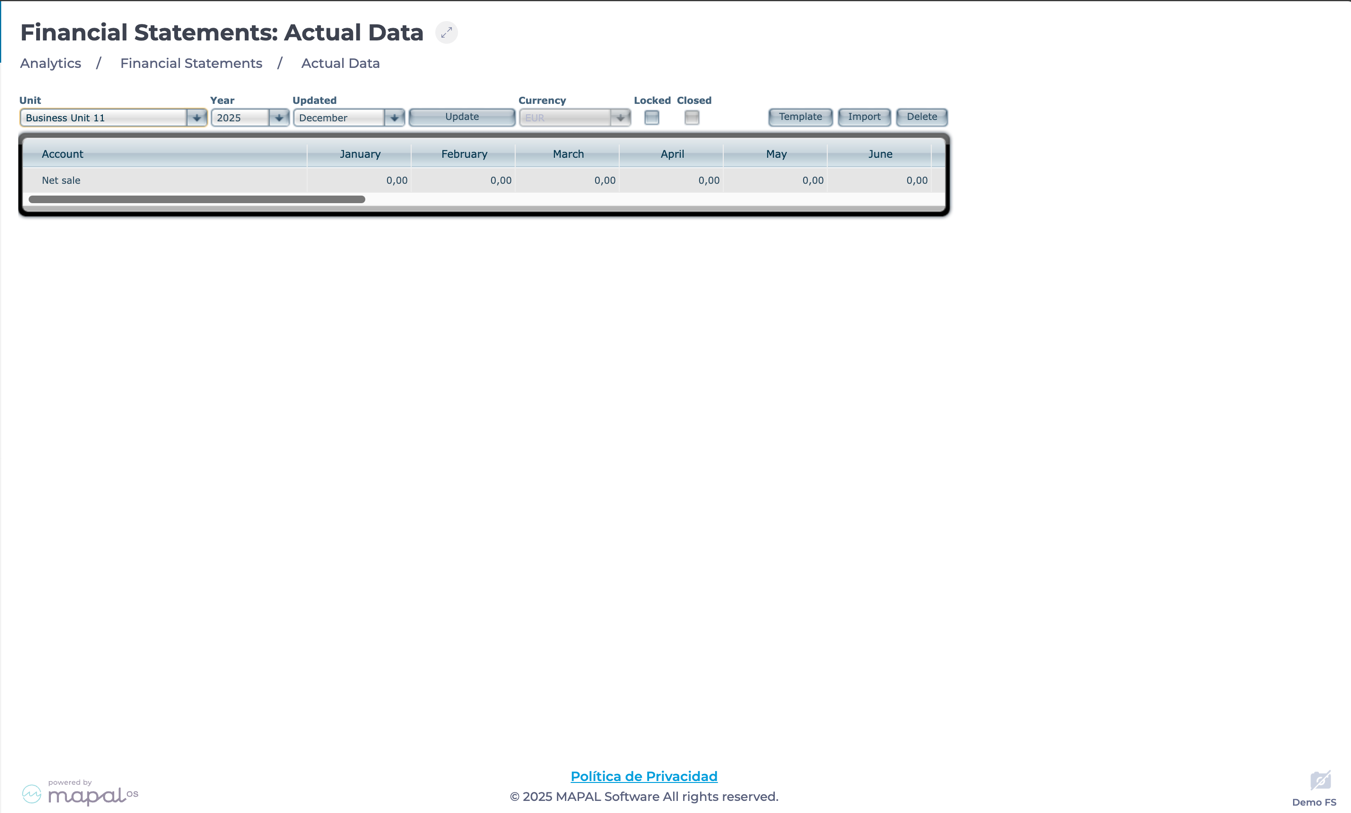
Navigate to Financial Statements > Actual Data.
-
Select the Business Unit from the dropdown menu.
-
Choose the Year you want to analyze.
-
Select the Month and press Update.
The system will display a structured table that includes:
-
Financial accounts (Rows): Net sales, food and beverage purchases, personnel costs, and other key financial indicators.
-
Monthly breakdown (Colums): Values distributed per month, facilitating trend identification and financial planning.

Actions on the Grid
-
Lock data for accuracy: Select the Locked checkbox to prevent modifications once the financial data is validated, ensuring integrity.
Notes: Ensure all financial records are accurate before locking them to maintain reliable reporting.
-
Export and import data:
-
Select Template to download the grid for external analysis.
-
Select Import to integrate financial data from other sources using the exported template format.
-
-
Delete data: Select Delete to remove all the data from the table, except for Net Sales, which will be set to 0.
-
Review change history: Below the grid, you can access records of locking and unlocking actions, including timestamps and responsible users.