


Start from: The Analytics dashboard.
-
Navigate to Interfaces > Imported Data.
-
This screen shows you a grid with all imported data from other systems, such as the POS and Inventory.
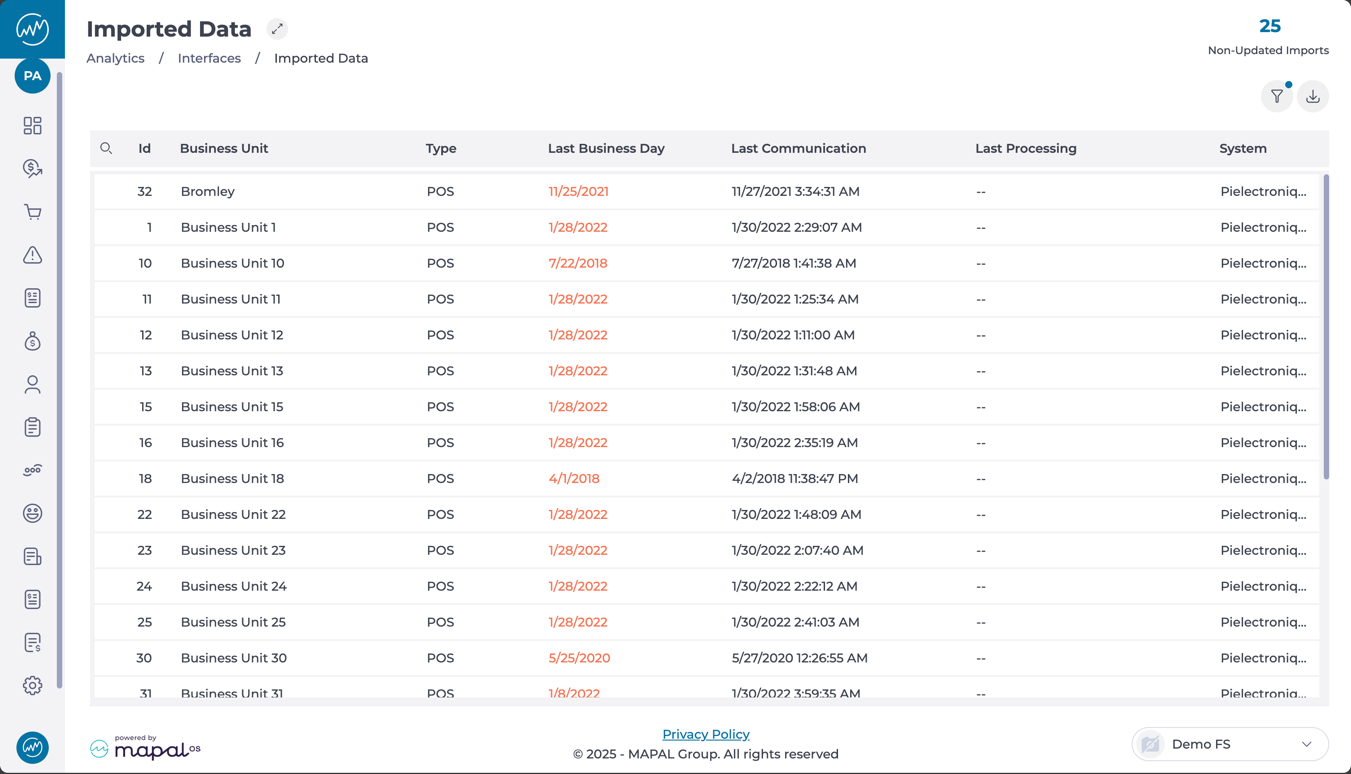
Understanding the Imported Data grid
The grid displays the following columns:
-
Id: Unique identifier for the business unit.
-
Business Unit: Name of the unit associated with the import.
-
Type: The type of data being imported (e.g., POS, Inventory).
-
Last Business Day: Last date for which data has been successfully imported. Dates shown in red indicate a delay or outdated import.
-
Last Communication: The most recent timestamp of communication between the data source and the system.
-
Last Processing: Date and time the data was last processed (may be blank if not yet processed).
-
System: Source system from which data is being imported (e.g., Pielectroniq, etc.).
At the top-right, you’ll also find a counter showing the total number of Non-Updated Imports, helping you quickly identify pending actions.
Main features of the Imported Data screen
-
Data validation: Checks the consistency of imported data before it is committed to the system.
-
Process automation: Allows data imports to be scheduled automatically at set intervals.
-
Activity logging: Maintains a detailed log of all import actions to support auditing.
-
Error handling: Identifies issues in real time and provides tools to resolve any inconsistencies.
-
Multi-format compatibility: Supports common file formats including CSV, XML, and JSON.
-
Reporting: Use the Export button to download a report of all your imported data.
Best practices
-
Always back up your data before beginning an import.
-
Test imported files in a staging environment before applying changes to the live system.
-
Schedule imports during off-peak hours to minimise disruption.
-
Document your import processes for future reference and consistency.
src="src="src="src="src="src="src="src="