


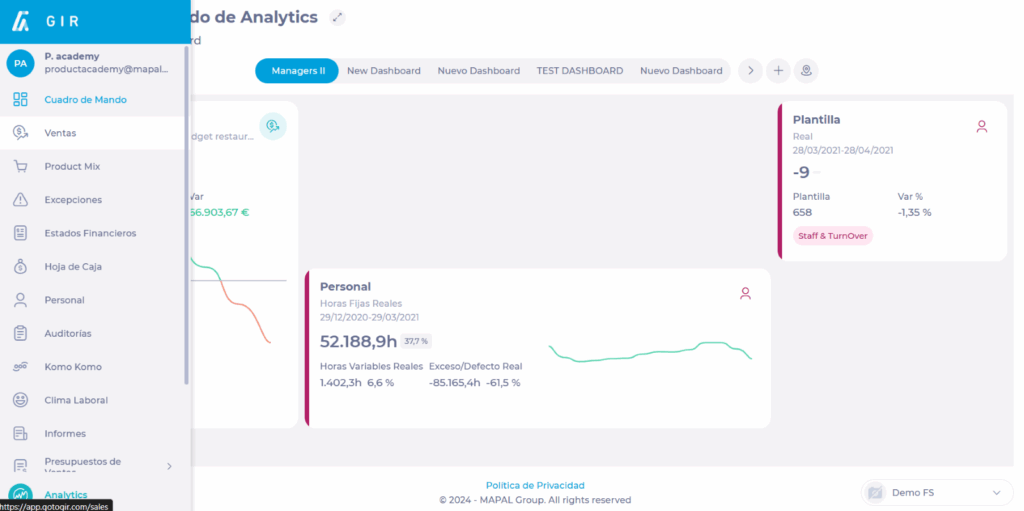
Start from: The Analytics module.
- Select Sales from the main menu.
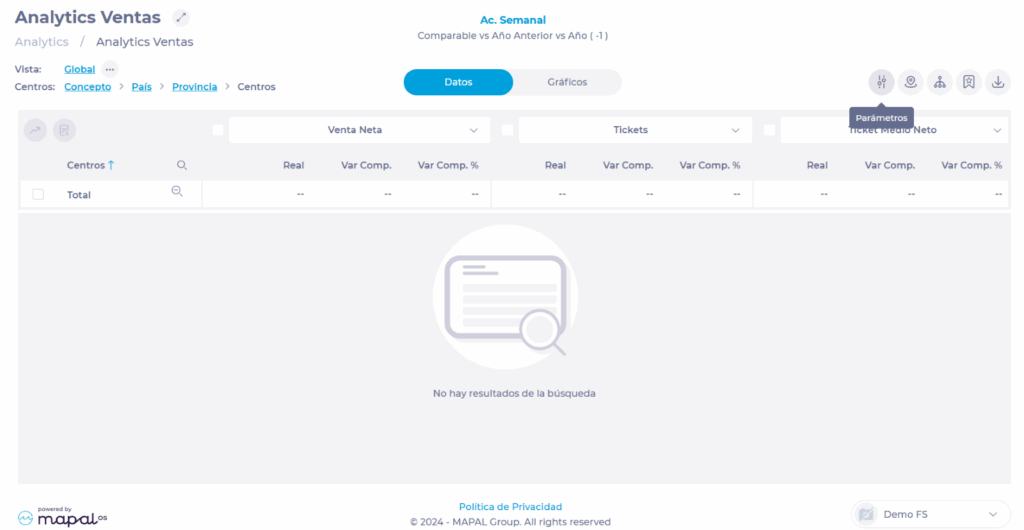
- Select the Parameters button.
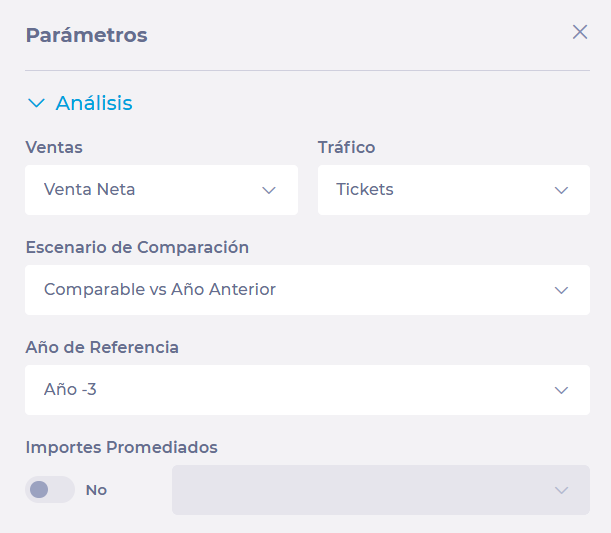
- In Analysis, set:
- If you want to visualize Sales as Net Sales or Gross Sales.
- If you want to see Traffic by Tickets or Guests.
- The Comparison Scenario of the analytics, can be Comparable vs Previous Year, Actual vs Previous Year, Actual vs Budget, Budget vs Previous Year.
- The Reference Year, which can be any in the last five (5) years.
- If you want to see Averaged Amounts, whether daily, weekly, monthly or annual.
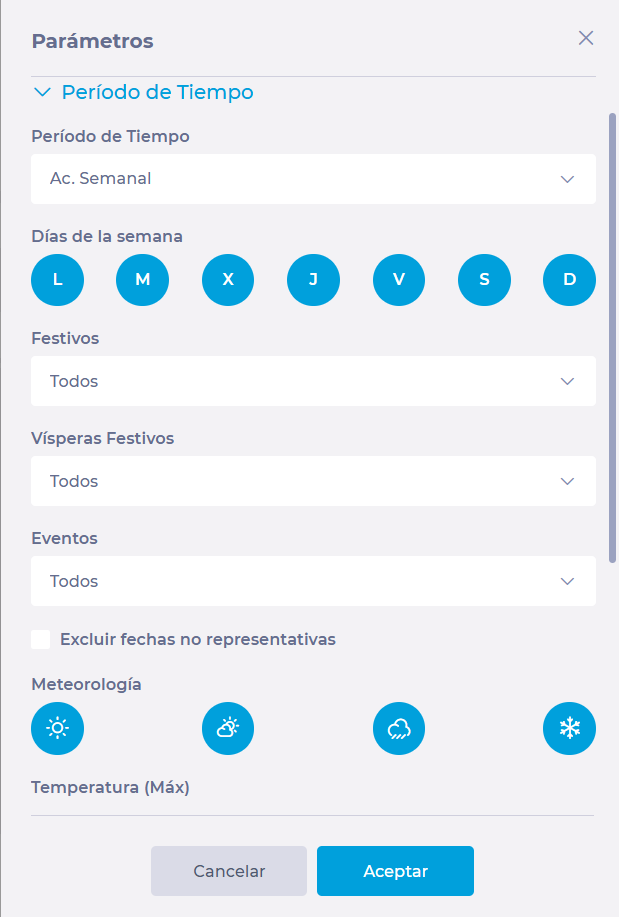
- In Time Period, set:
- The Time period you want to see. You can see the last day, week, month, year or a specific date range that you select.
- If you want to exclude or include specific days of the week.
- If you want to include Holidays, Holiday Eves, Events and Exclude non-representative dates.
- If you want to filter by Weather or Temperatures.
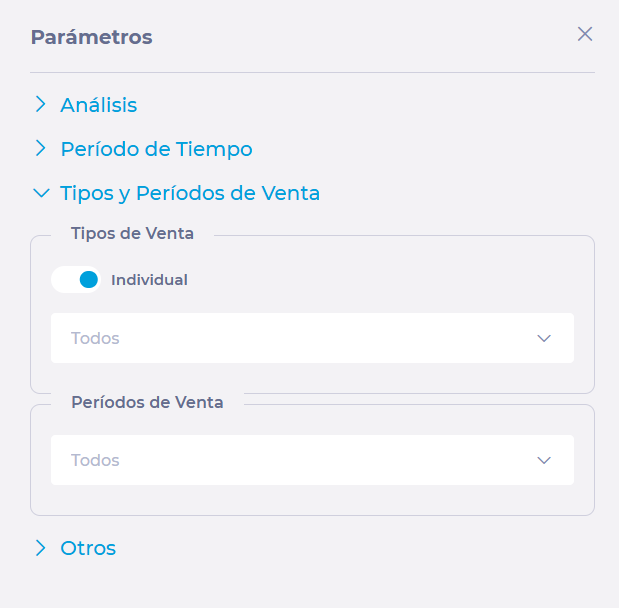
- In Sales Type and Periods, set:
- If you want to see Individual sales types or Groups of sales types. Then, select the specific type or group of types from the dropdown.
- If you want to see one or all Sales Periods.
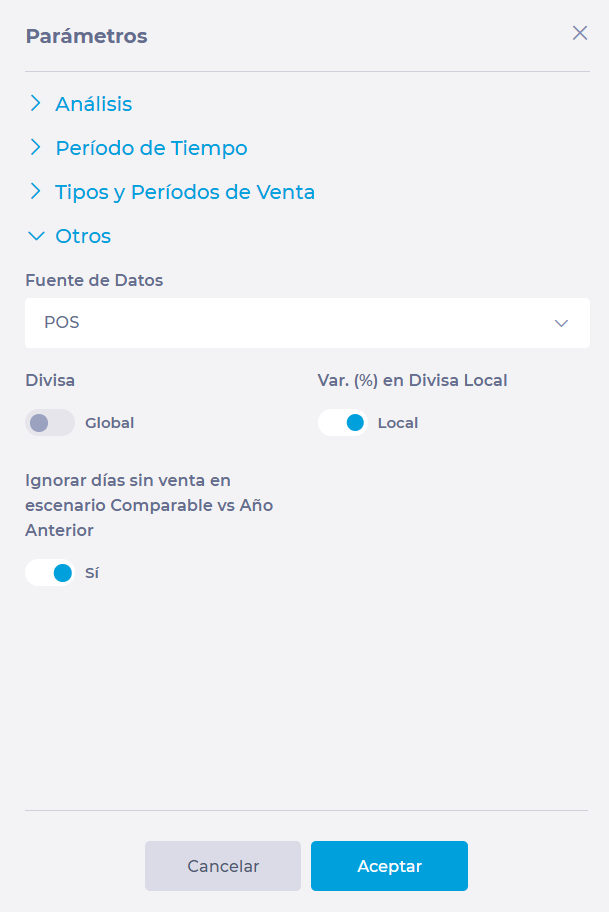
- In Others, you can set parameters such as data source, currencies, percentage variations in local currency or ignore days without sales. At this point, you will establish if the data will come from the POS or from the Cash Sheet.
- Once the parameterization is completed, select Accept to save it OR Cancel to discard it.
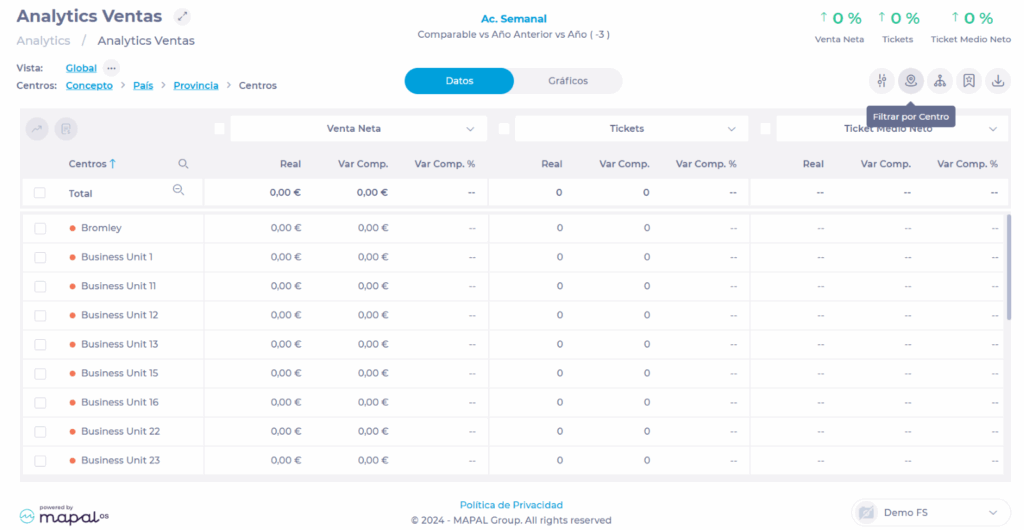
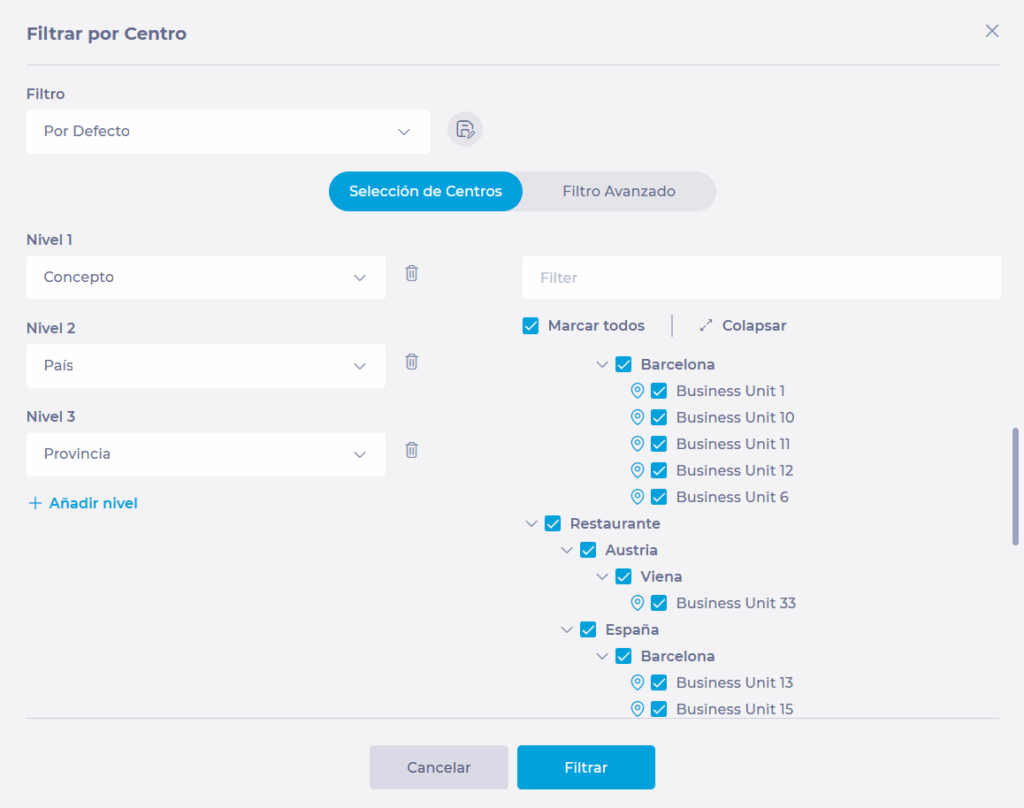
- Back on the Sales Analytics screen, select Filter by Center.
- In this window, you will be able to select the specific center or centers for which you want to visualize the data.
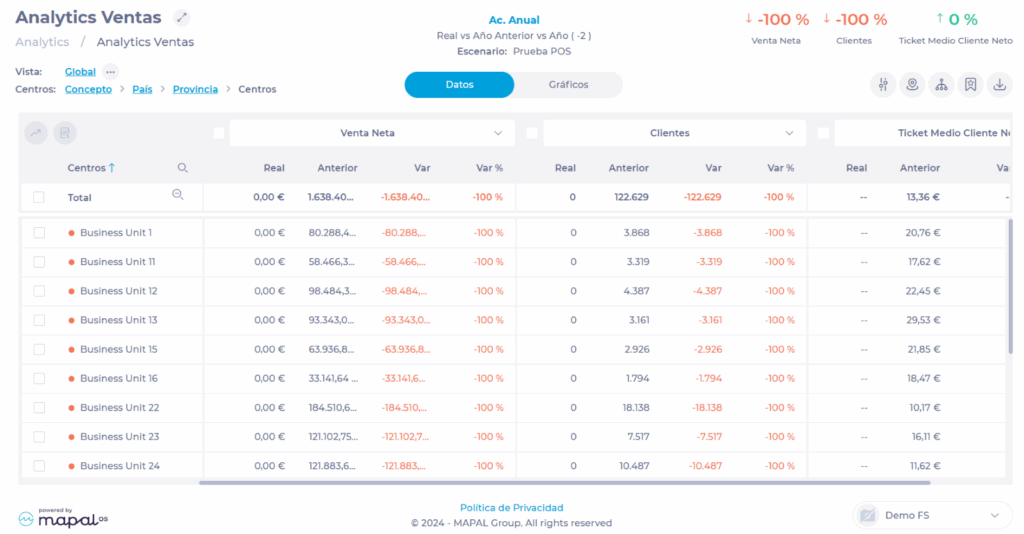
- Once the centers are selected, the Sales Analytics screen will show you a list of the selected centers with their respective data. On this screen you will be able to get an overview of actual sales, previous year sales (based on the comparable year), and the variation both in percentages and amounts.
This parameterization can be saved later as a Scenario, which will allow you to present it permanently on a Dashboard or make a comparison with another scenario.
Navigate through sales
Once you deploy the data, you will be able to navigate through the sales screen using different tools available in the panel.
To learn more, see Navigate using views and levels in Analytics.