


Start from: The Mapal Manager home screen.
Change the grouping level
- On the Sales screen, open the More Options button (...).
- Select Group by from the menu.
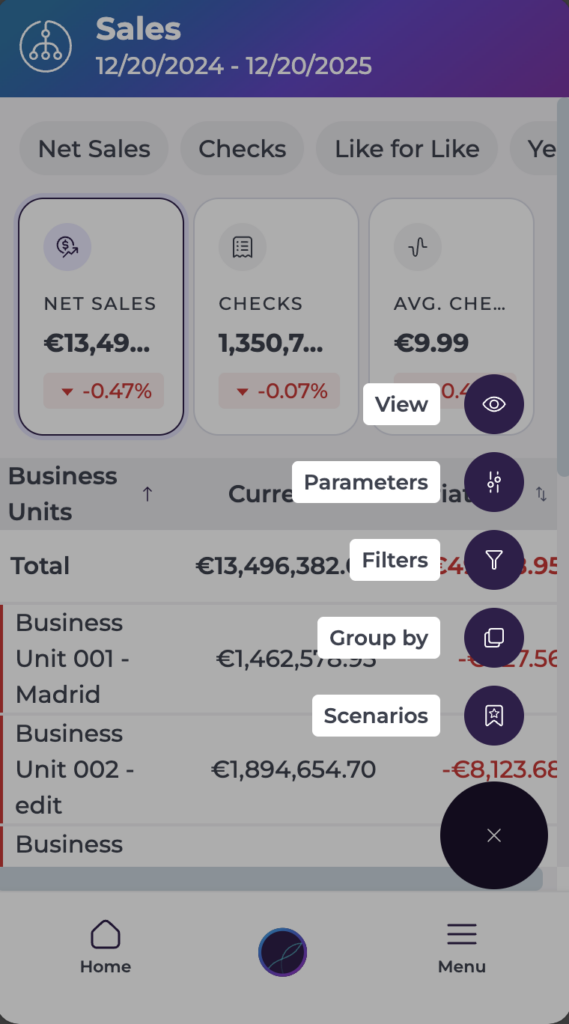
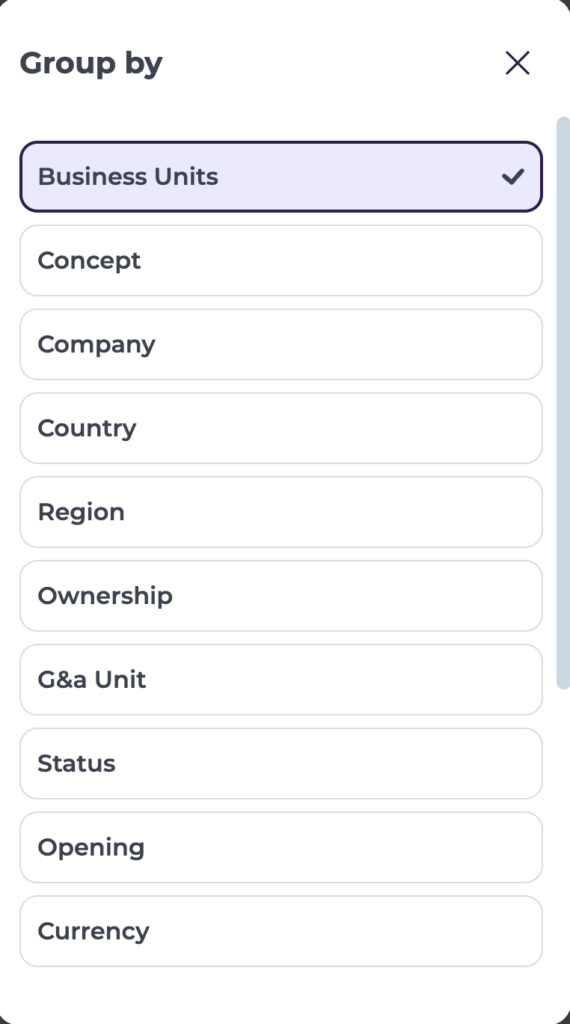
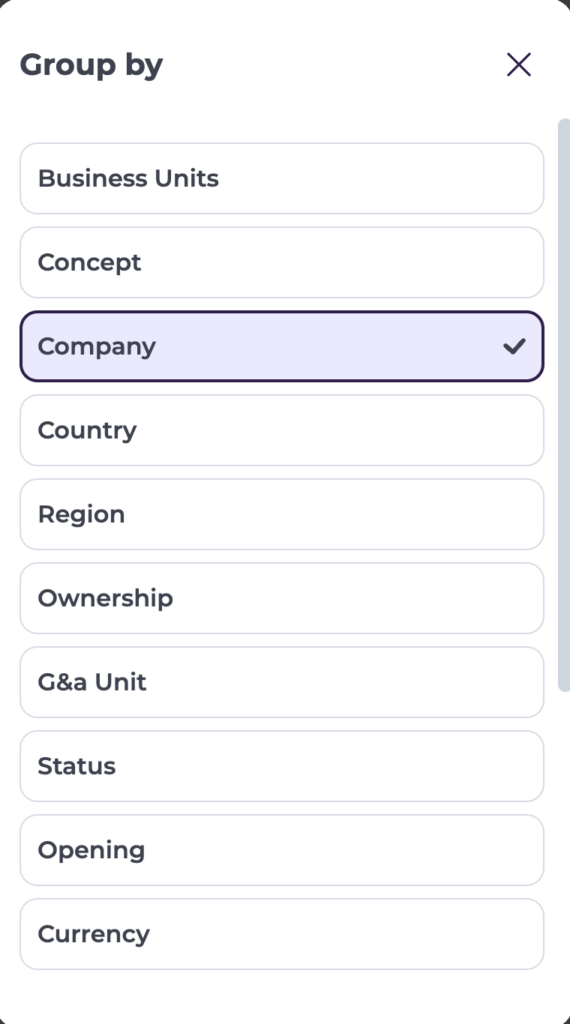
- The Group by panel opens with a list of grouping options, such as:
- Business unit
- Concept
- Company
- Country
- Region
- Ownership
- Status
- Opening
- Currency
- Post Code
- City
- Type
- Tap the grouping option you want to use. Only one grouping can be active at a time.
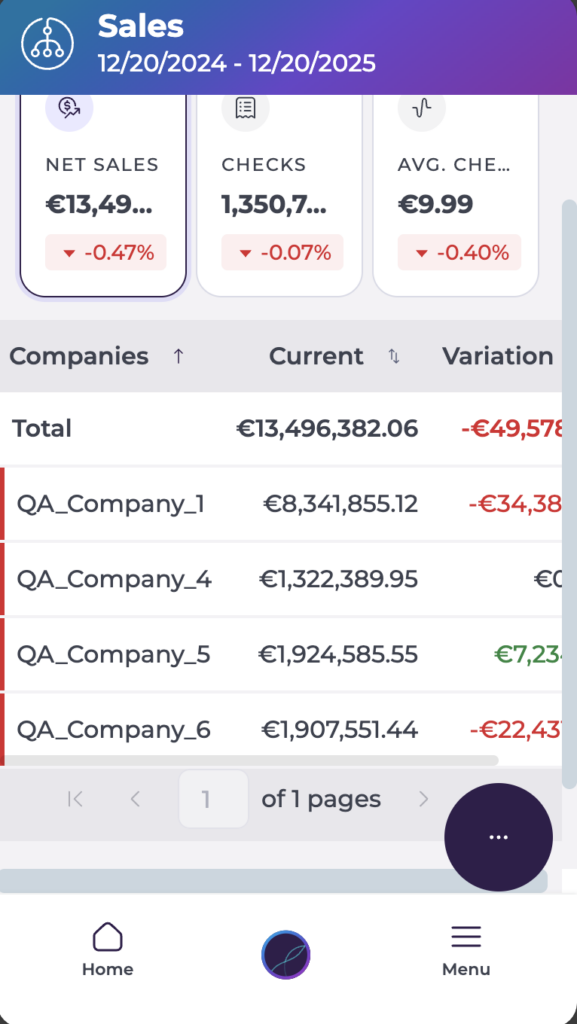
- The Sales view automatically updates with the new grouping.
How grouping affects the Sales screen
Metric cards
The three metric cards at the top of the screen (Net Sales, Checks, Average Check) remain unchanged when you change the grouping. They continue to show:
- Totals for the selected business units and time period.
- Percentage differences against the chosen comparison scenario.
Grouping does not change these totals, only how the data is split underneath.
Breakdown list under the cards
The list or table below the metric cards is where grouping takes effect:
- When grouped by Business unit, each row represents a site or location.
- When grouped by Brand, each row represents a brand.
- When grouped by Country, each row represents a country.
For each row, you see:
- The value of the currently selected metric (Net Sales, Checks or Average Check).
- The percentage comparison versus the selected comparison period.
- Any colour or arrow indicators for up/down performance.
Depending on your version, rows may be tappable or expandable to open a deeper level of detail.
How grouping works with filters
Grouping and filters work together:
- Filters (for example, by country, brand or business unit) define which data is included.
- Grouping defines how that data is organised in the list.
If you have filters applied, only groups that match those filters will appear in the breakdown list.
Switching between groupings
You can repeat the same steps to switch grouping at any time:
- Open the More Options button (...) and select Group by.
- Choose a different grouping option (for example, switch from Business unit to Company).
The list beneath the metric cards reorganises to show results by the new grouping, while the totals on the metric cards remain the same for the current filters and period.
How grouping behaves over time
- Grouping is most useful for users with visibility across multiple locations, brands or regions.
- The selected grouping stays active until you change it or load a saved Analytics scenario.
- Loading a scenario can overwrite your current grouping with the one stored in that scenario.
- If you choose a grouping where you do not have access to some units, those units will not appear and the list may show fewer rows than expected, based on your permissions.