


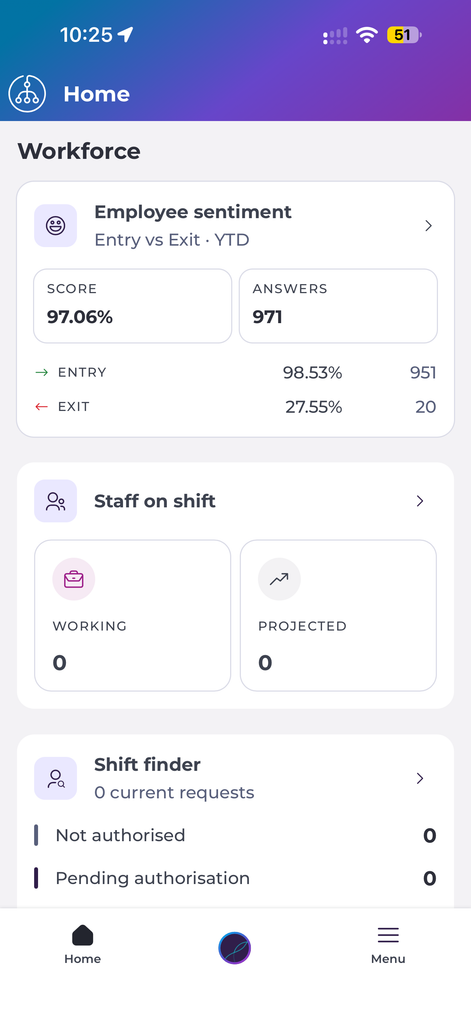
Start from: The Mapal Manager home screen.
View the sentiment summary
The Employee sentiment tile on the home screen shows the current view and period, for example Entry vs Exit · YTD. It displays:
- Score: the overall sentiment score.
- Answers: the total number of answers.
- Entry and Exit: the score and number of answers for each.
- Select the Employee sentiment tile to open the full analysis.
Review sentiment by business unit
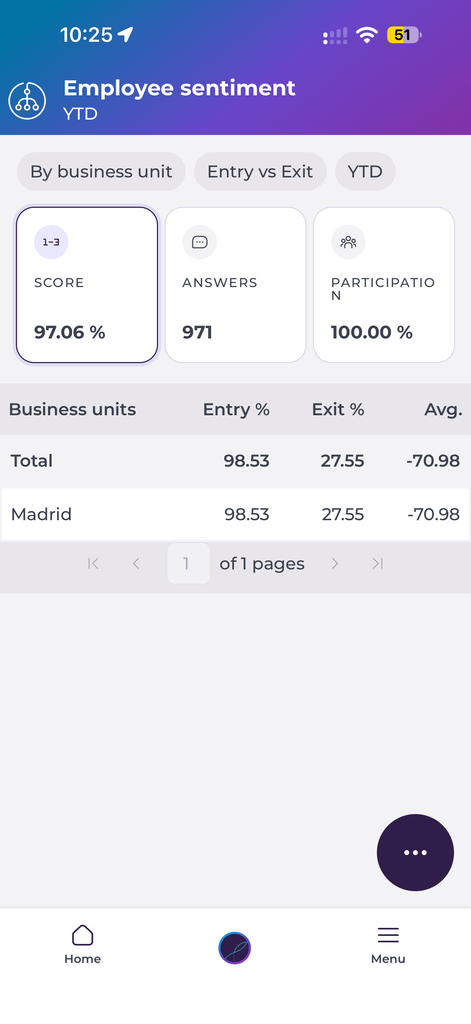
The selected analysis, view and period appear at the top of the Employee sentiment screen, so you can always see which selection the data reflects.
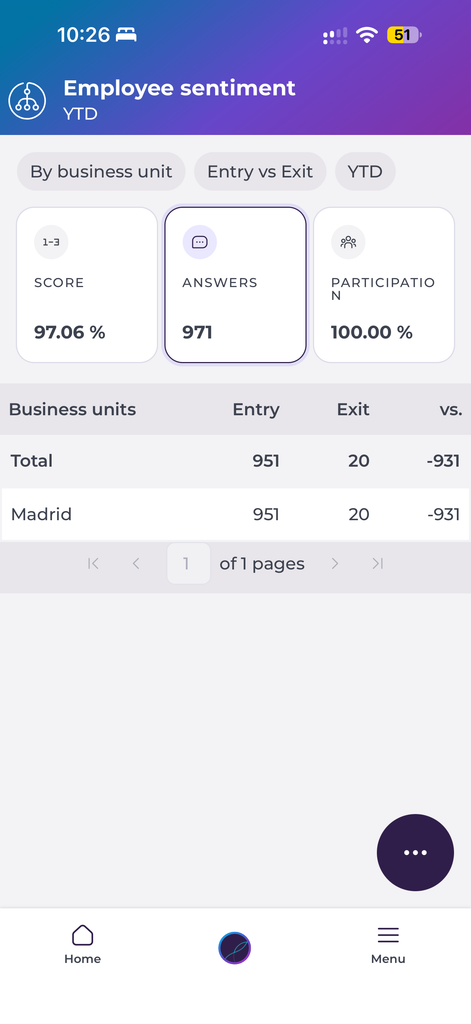
Select Score, Answers or Participation to change the values shown in the table:
- Score shows Entry %, Exit % and Avg. for each business unit.
- Answers shows the number of Entry and Exit answers, and the difference between them in vs.
- Participation shows Entry %, Exit % and the difference in percentage points in vs. pp.
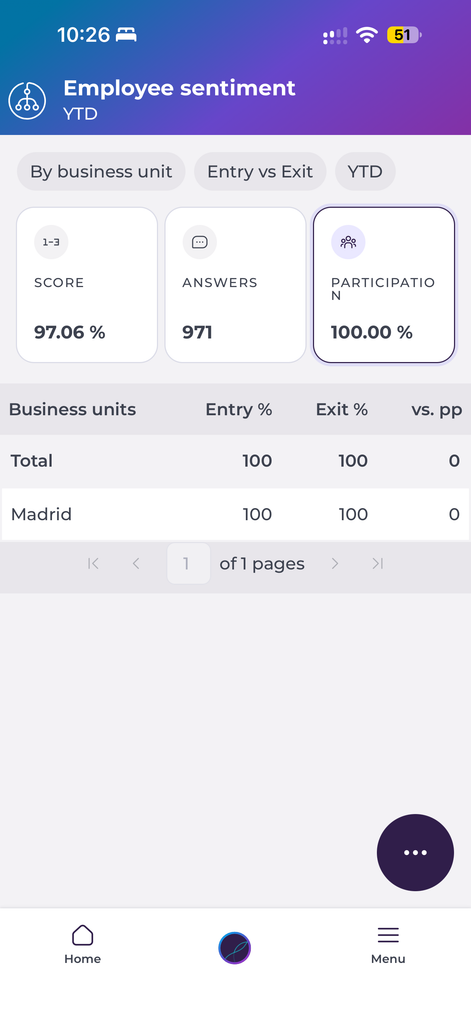
- The Total row shows the combined result for all business units in the table.
Change what the data shows
- Select the action menu (...) to open the analysis options.
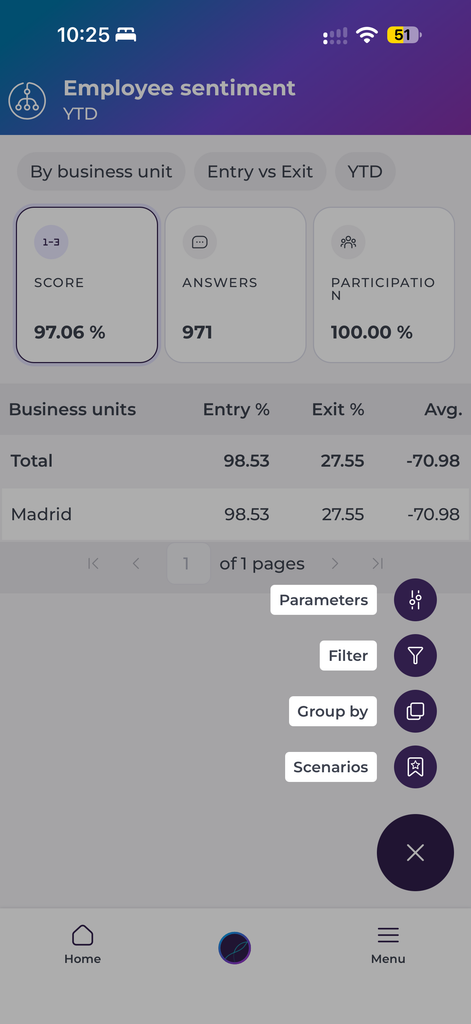
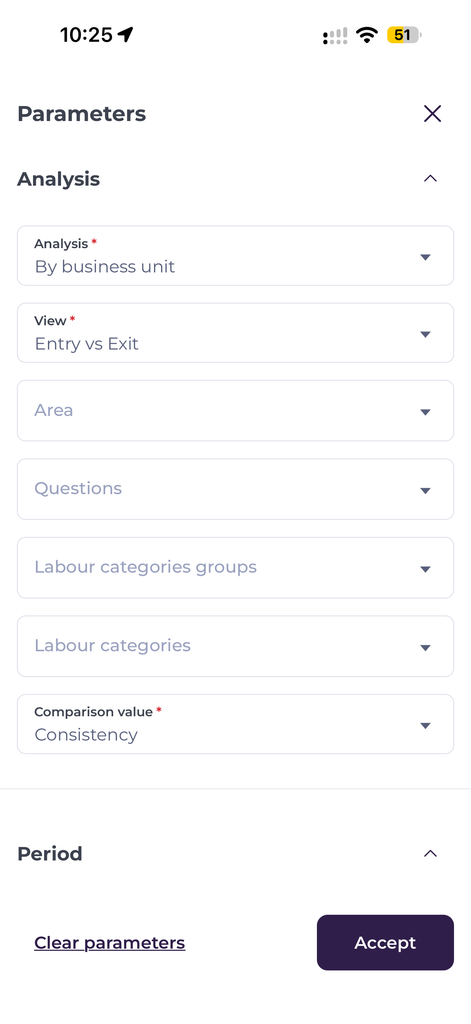
- Select Parameters to change the analysis settings:
- Analysis: how the data is analysed, for example By business unit.
- View: the sentiment view, for example Entry vs Exit.
- (Optional) Area, Questions, Labour categories groups and Labour categories: narrow the answers included.
- Comparison value: the value used for comparison, for example Consistency.
- Period: the time period, for example YTD.
- Days: the days of the week to include. All days are selected by default.
- Select Accept to apply the parameters, or Clear parameters to reset them.
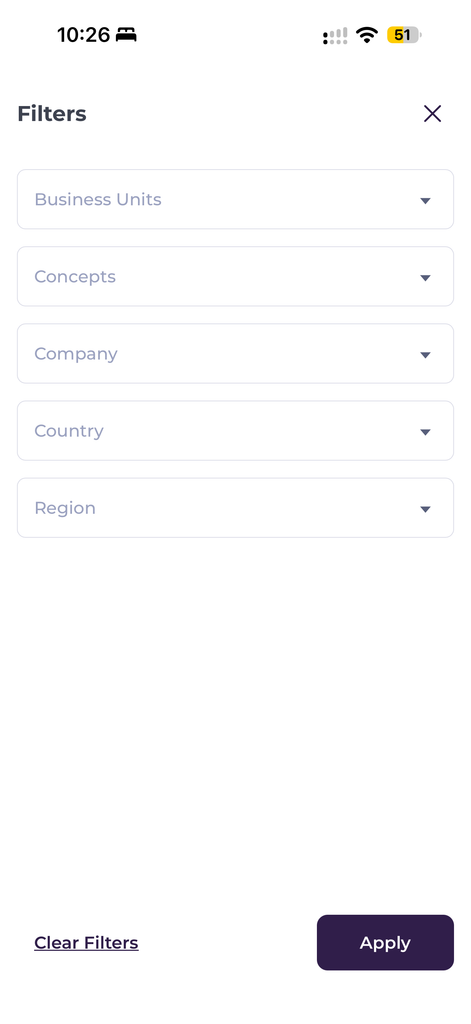
- Select Filter to limit the data by Business Units, Concepts, Company, Country or Region. Select Apply, or Clear Filters to reset.
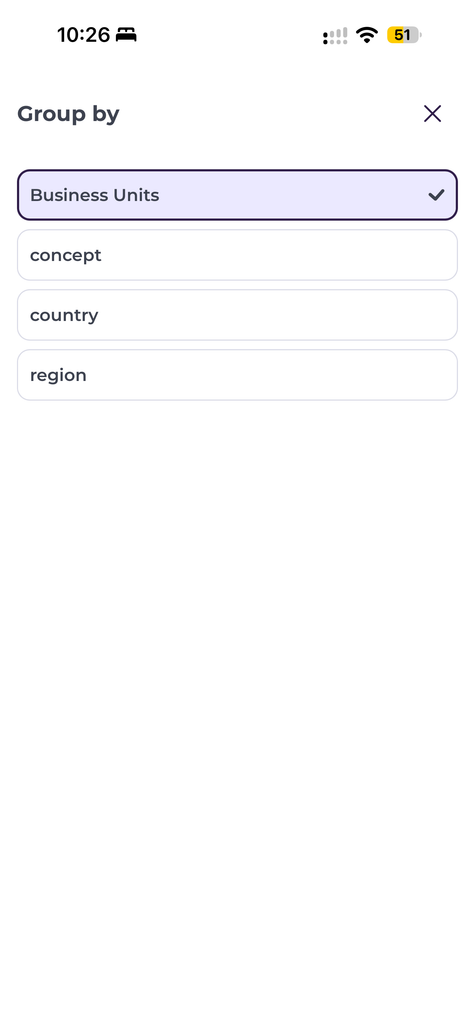
- Select Group by to group the table by Business Units, concept, country or region.
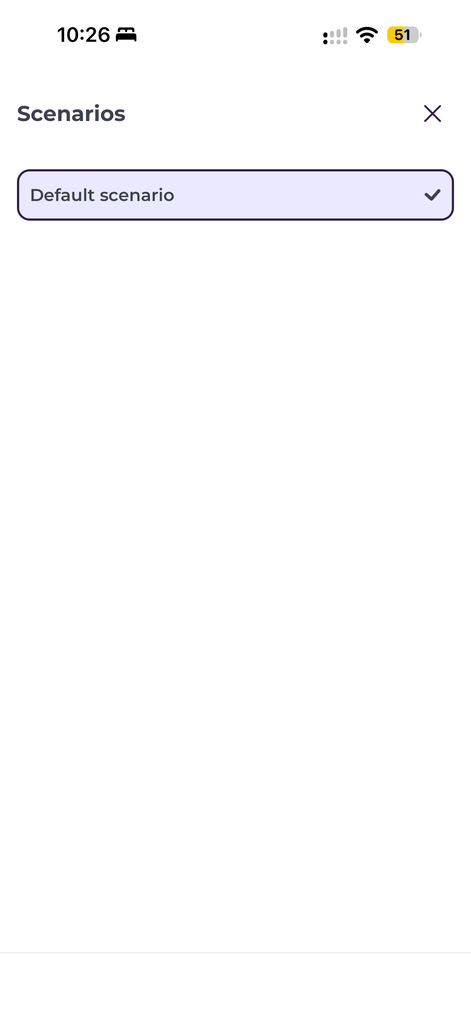
- Select Scenarios to load a saved scenario, for example Default scenario.
Note: Fields marked with an asterisk are required.
These options work the same way in all three views.
