


Start from: The Engagement module.
When opening Engagement, you will automatically see the Dashboard. If you are navigating Engagement, you can return to the dashboard by selecting Home from the main menu.
- The Dashboard is made up of 7 tiles:
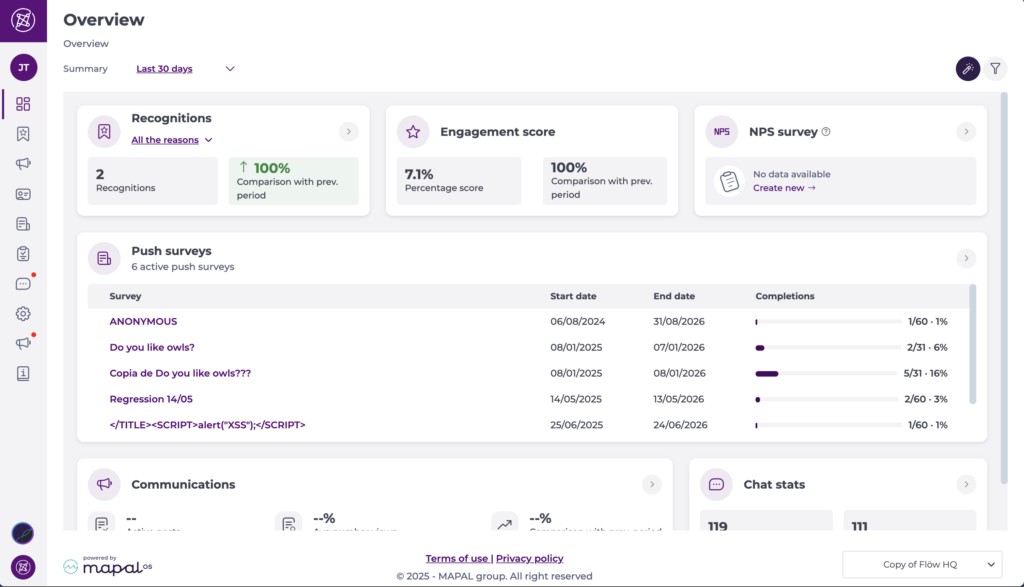
Recognitions
This tile displays a summary of all recognitions awarded during the timeframe chosen in the date selector. This is then compared as a percentage to the preceding period. For a more detailed analysis, users can filter by specific reasons for recognition.
A navigation button ( > ) is available on the tile, allowing you to jump directly to the Recognitions page for more detailed review.
Engagement Score
The Engagement Score is calculated by an algorithm that analyses how actively employees interact with Engagement. It combines recognition rate (how often recognitions are given and received), survey response rate, and read rate for news and communications. A high survey response rate (typically above 60%) is treated as especially positive and is given additional weight in the calculation.
This tile is informational only and does not include a navigation button.
NPS survey
This tile shows the Net Promoter Score (NPS) for your active NPS surveys within the selected timeframe. It appears when NPS surveys are enabled for your organisation and your profile has permission to view survey results. You can use the dropdown on the tile to select a specific NPS survey and see its average NPS, calculated as Promoters minus Detractors on a -100 to +100 scale.
You can select the tile’s navigation button ( > ) to go straight to the Survey List page for more detailed NPS survey management and reporting.
Push Surveys
This tile gives an overview of any active surveys on the platform, including start and end dates, and the percentage or number of survey completions.
You can select the tile’s navigation button ( > ) to go straight to the Push Surveys page, where you can manage surveys, see answers, and export surveys information.
Communications
This shows the number of active posts across the platform, including the average number of views as a percentage and a comparison with the preceding period.
A navigation button ( > ) on this tile takes you directly to the Communications > Publications page, making it easy to review posts, comments, likes, and engagement levels.
Chat stats
The Chat Stats tile is only available to admins. This tile provides insights into chat activity across your organisation:
- Active Group Chats: the number of active group conversations within the chosen timeframe.
- Peer-to-Peer Chats: the number of direct one-to-one conversations.
If available for your access level, the tile includes a navigation button ( > ) allowing you to open the Chat > Group chats page for a more detailed breakdown.
Notes: Data is updated daily. A tooltip shows the last updated timestamp for transparency.
Reported items and messages
This tile is available to managers and administrators and displays content that has been flagged for review. It provides a quick overview of reported items across your organisation that need moderation.
The tile shows:
- Reported items in communications: the number of flagged posts or comments in news and forum communications.
- Reported messages in chats: the number of flagged messages in group or peer-to-peer chats.
Selecting the tile takes you directly to the relevant moderation page, where you can review and take action on reported content. For more information about managing reported content, see Manage news moderation for flagged comments and Manage chat moderation for flagged messages.
Comparison with the previous period
The comparison with the previous period has three ways of showing the information:
- Green colour: The best one, the positive result. This indicates that the current period has been better than the previous one, so there has been an improvement.
- Red colour: The negative result. Indicates that this period has been worse than the previous one.
- Grey colour: This happens when there is no data to make the comparison.

Visualization scenarios
The dashboard will only show data corresponding to the access levels set up for your user profile or company. There are two possible scenarios in which your data view could be limited:
- When the company doesn't have these features
- When the user doesn't have access to these features
When the company doesn't have these features
In the first scenario, the user will find those tiles that are not included in the company's plan like this:
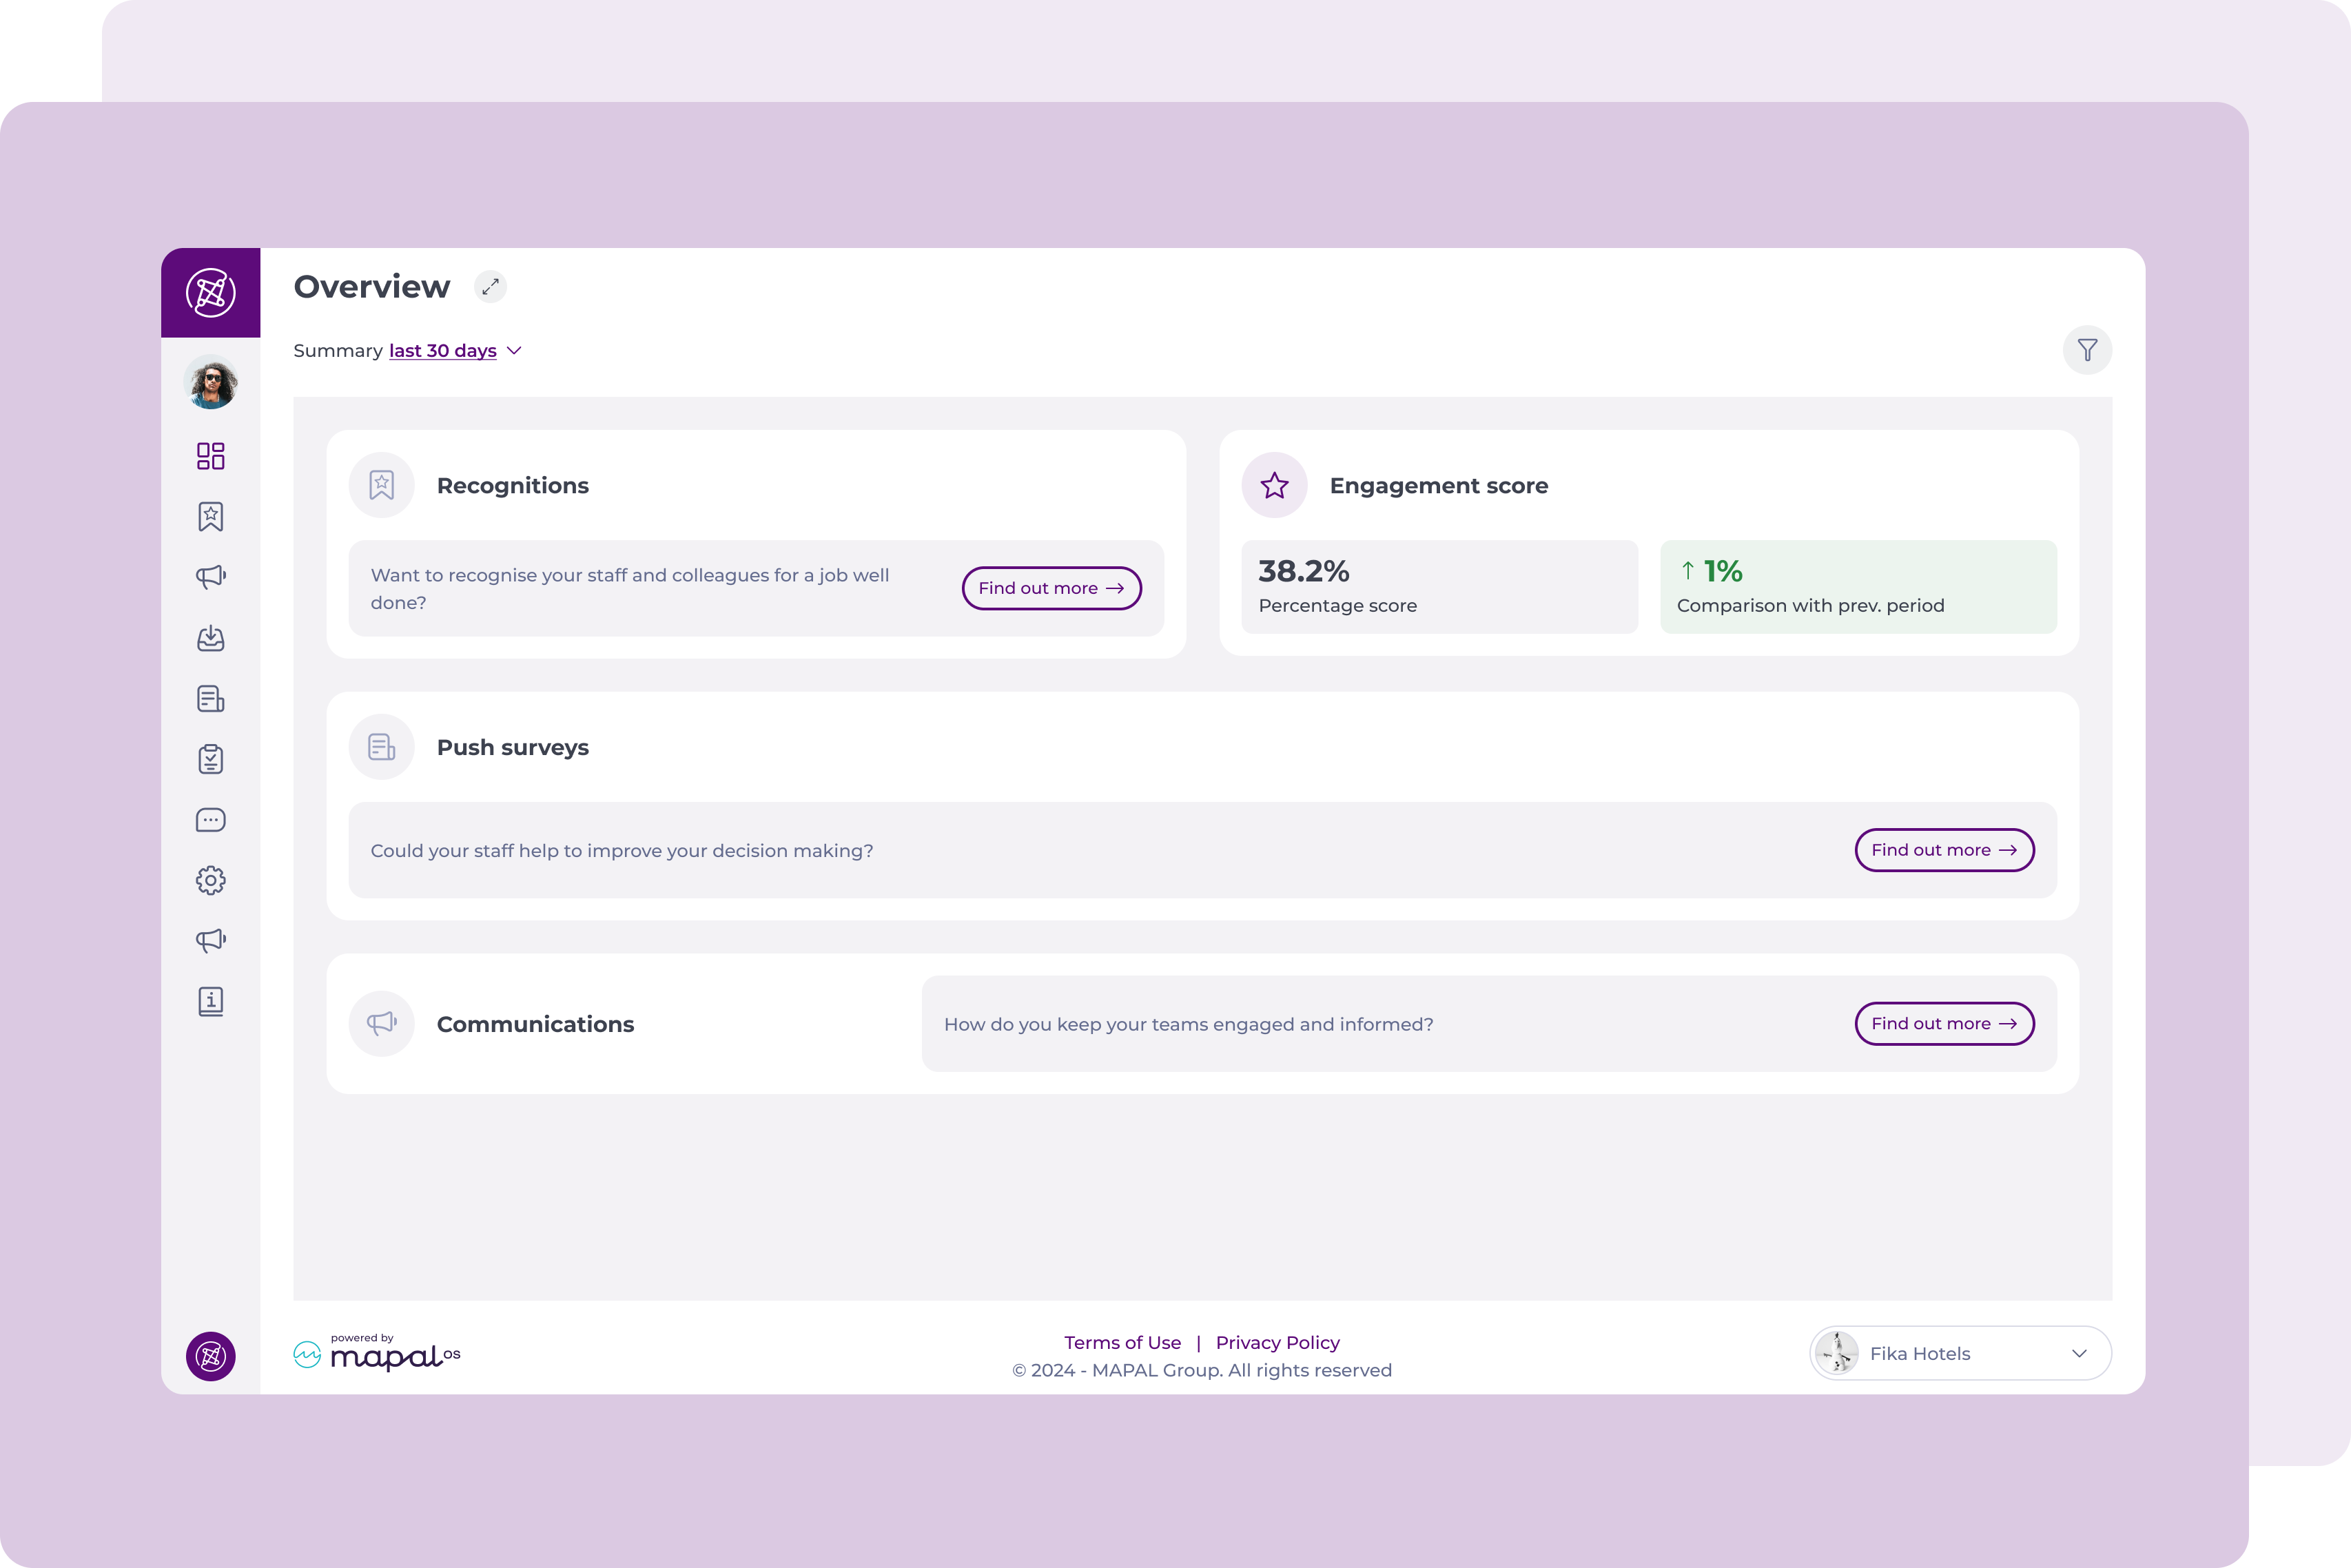
The icons look disabled, and the content is replaced with marketing text. Next to it, the user can find a button that brings access to upgrade their plan.
The Engagement score tile will always appear, as it's info available to everyone.
When the user doesn't have access to these features
In the second scenario, those sections without access are marked as forbidden, but the user still sees the tiles active. The content has been replaced with the copy: No access. You don't have permission to access this feature.
Also, tiles such as Push Surveys and other forbidden ones are smaller. There is no need to maintain the height in these cases, so the size is reduced.
In this case, the Engagement score also appears, as it is info available to everyone.

Notes: The user will always see these 4 tiles (recognitions, engagement score, push surveys, and communications) even if the section is not allowed for him/her, or even if the company hasn't hired this feature.
Filter
Users can Filter the data they see in the Engagement dashboard.
The available filters are Dates (shown at the top left corner) and Employee by level (selecting the filter icon at the top right corner).
Notes: In the case of the Employee by level filter, the first field filters the second field, and the second field filters the third field. This is the way this filter works.

Switching between multiple operators
Users who have the same email registered with multiple operators are able to switch between operators.
- Find the pop-up operators list to view the operators available (this is usually towards the bottom right of the screen).
- Select the operator you want to switch to.