


Start from: The Flow Learning dashboard.
- Navigate to Reports > Learner Progress Report from the main menu.
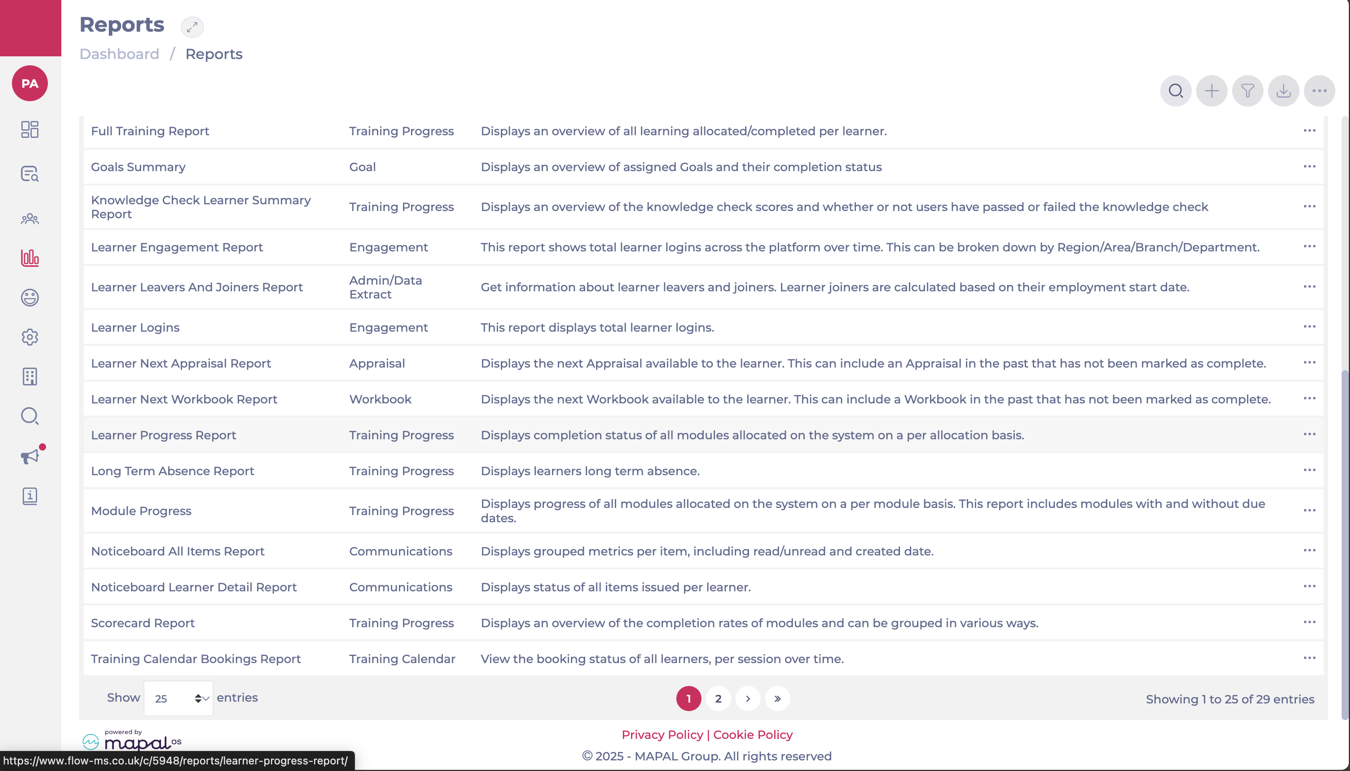
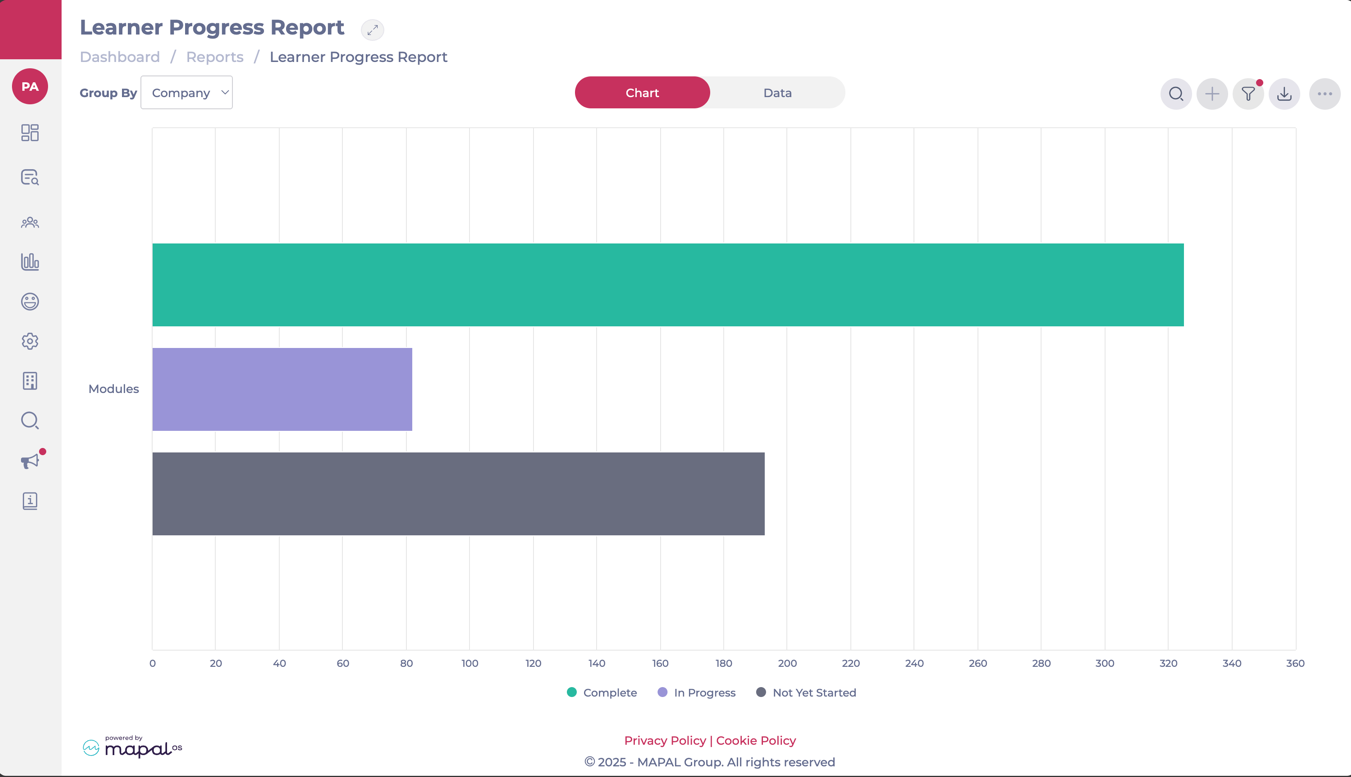
- This report gives a clear overview of learner engagement and progress across all assigned modules in Data and Charts form.
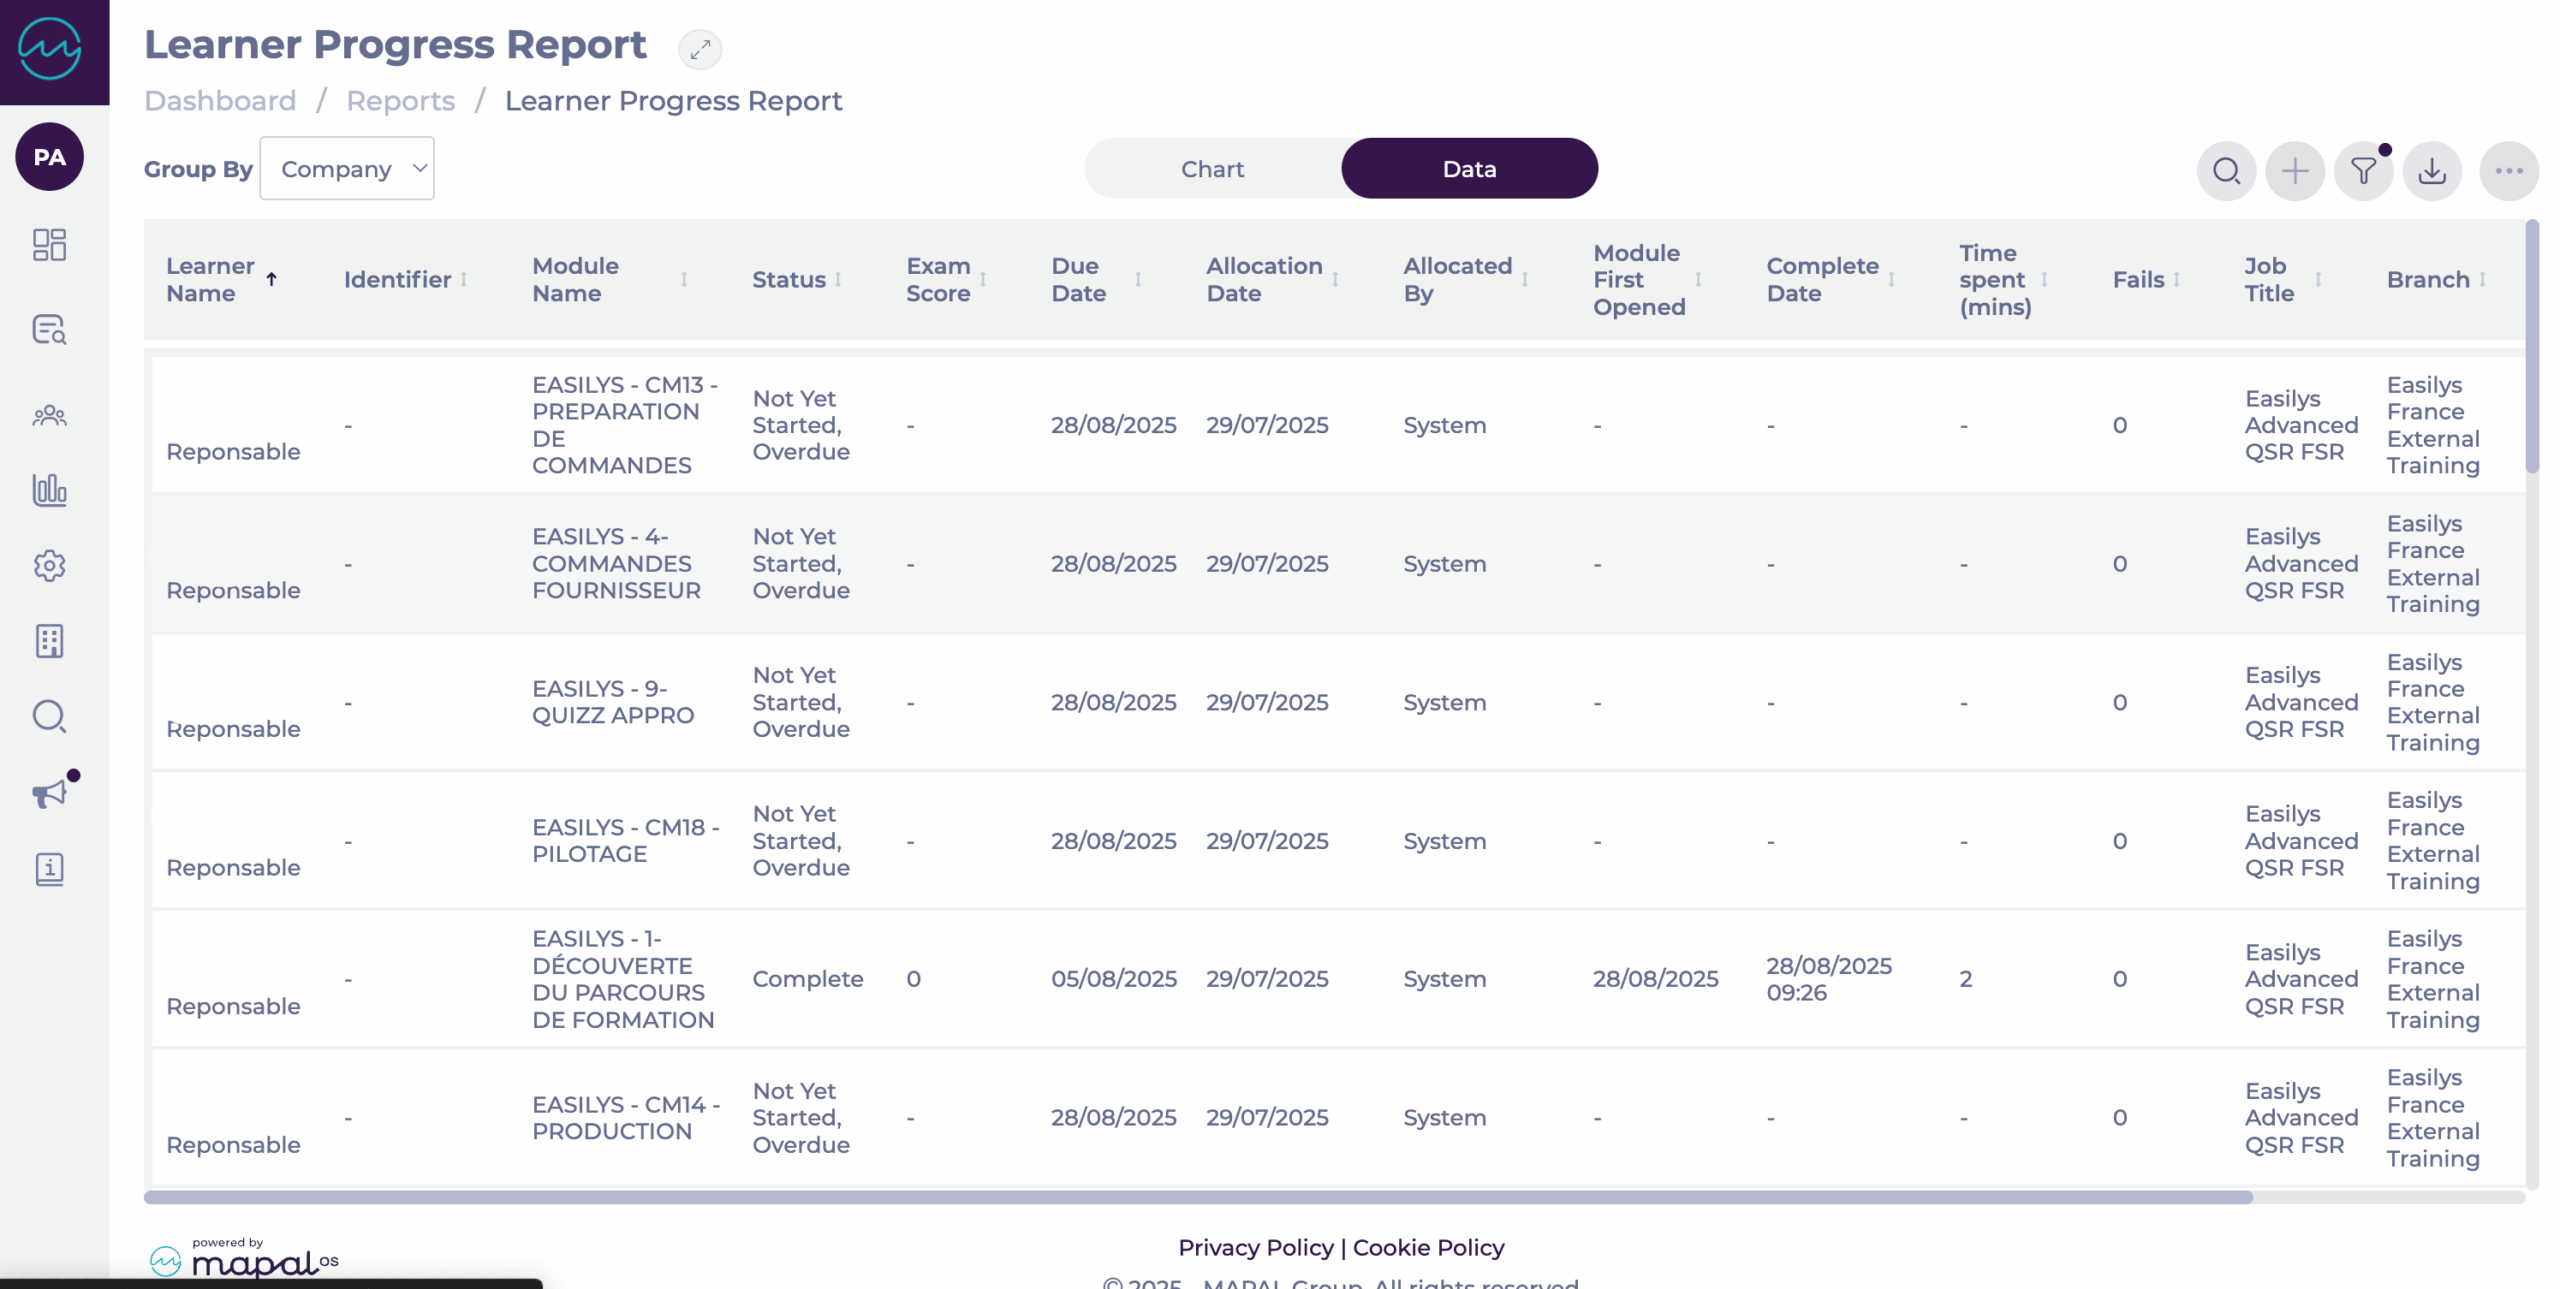
Understanding the columns in the Data tab
When you switch to the Data tab, each row represents a learner/module record. Columns include:
- Learner Name
- Identifier
- Module Name
- Status
- Exam Score
- Due Date
- Allocation Date
- Allocated By
- Module First Opened
- Complete Date
- Time Spent (mins)
- Fails
Notes: Fails are only shown in the Data view. Fail counts are tracked for both Editor and Evolve modules.
- Job Title
- Branch
- Area
- Division
Sorting and filtering the report
- At the top of the screen, use the Group By dropdown to organise the report by:
- Company
- Division
- Section
- Region
- Area
- Branch
- Use the Search bar to look for specific learners or modules.
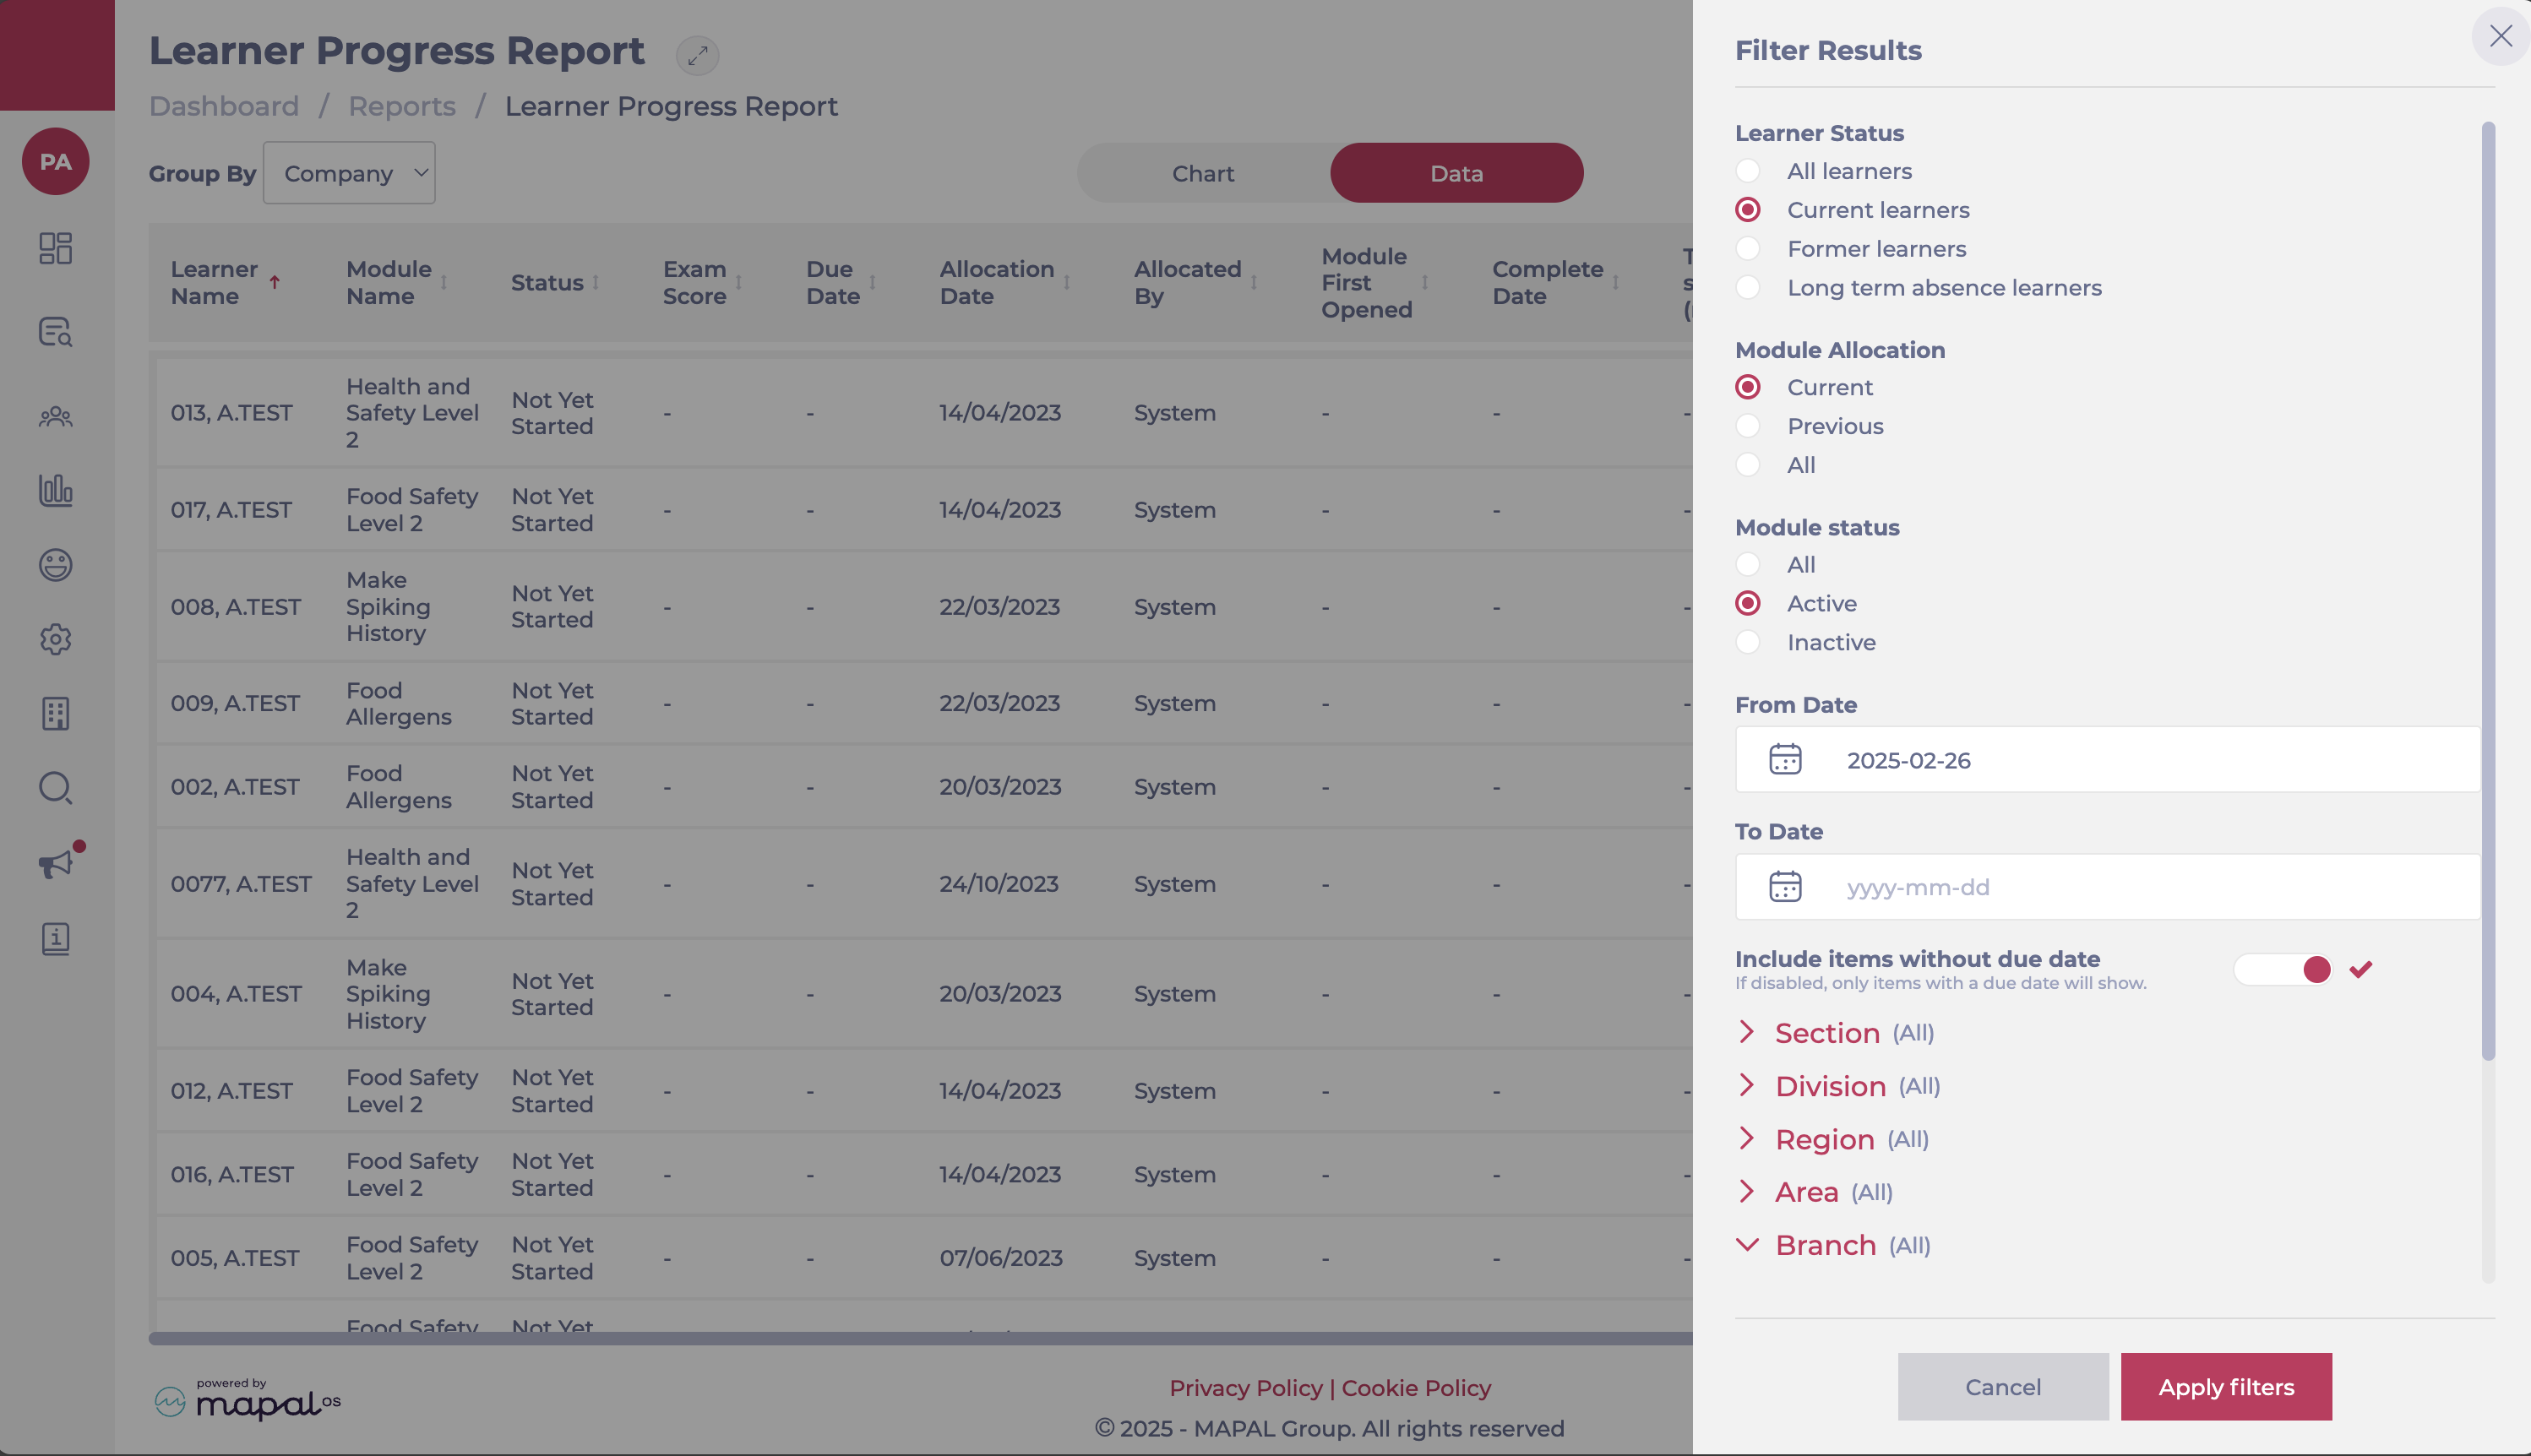
- Use the Filter panel to narrow your view by specific:
- Learner Status
- Module Allocation
- Module Status
- Dates. Note: The Date Filter is set to show data from the previous month by default. If you don’t see the data you expect, update the date range to include the current period or your desired timeframe. You can also select if you want to see only items with or without due dates.
- Sections
- Divisions
- Regions
- Areas
- Branches
- Departments
- Job Titles
- Modules
- Progress Statuses
Export your report
- Use the Export button to download the report in your preferred format:
- Data to CSV
- Chart to PDF
- Chart to JPEG